Showing posts with label Ministry for the Environment. Show all posts

06 June 2023

The unbearable annual updates to the NZ ETS auction volume limits and price control settings for units 2023

The Ministry for the Environment is running a consultation on the utterly incomprehensible Annual updates to the NZ ETS limits and price control settings for units 2023.

There is a very dense 56 page consultation paper Ministry for the Environment. 2023. Annual updates to New Zealand Emissions Trading Scheme limits and price control settings for units 2023: Consultation document. Wellington: Ministry for the Environment..

This is based on another annual round of dense advice over 64 pages from the Climate Change Commission Advice on NZ ETS unit limits and price control settings for 2024-2028

I wrote a submission today. Due to the density of the reports, and the way Ministry for the Environment framed the 24 compulsory questions, it was really hard. Submissions close on 16 June 2023.

I can however try to summarise it in three charts.

The Climate Change Commission wants the Government to reduce the number of emission units it auctions from 2026 to 2028.

The Climate Change Commission wants the Government to increase the minimum price for emission units in the auctions from 2026 to 2028.

The Climate Change Commission wants the Government to increase the cost containment reserve 'maximum price' for emission units in the auctions from 2026 to 2028.

I am guessing that a Chris Hipkins led Labour Government is probably going to try to ignore the Commission's recomendations.

Russell McVeagh have the best short summary of the issues: Climate Change Commission urges Government to reduce ETS unit supply and raise trigger prices.

29 March 2023

More of the endless cycle of incremental reform of the emissions trading scheme

There is a new Cabinet paper to read; "A Review of the Emissions Trading Scheme", 28 pages, by the Office of the Minister of Climate Change

What use is a Cabinet paper when the key policy options are redacted?

Last Wednesday 22 March 2023, the Ministry for the Environment announced yet another review of the My-Eyes-Glaze-Over New Zealand Emissions Trading Scheme.

For some reason, I downloaded the Cabinet paper.

For some even more masochistic reason, I actually read all 28 pages.

It was largely a waste of time.

I can't even use the metaphor that the Cabinet paper was "rearranging the deckchairs on the Titanic" as I have already used that title on a blog post on a past consultation on industrial allocation.

The first paragraph of the Cabinet paper tells us what the paper is about. So far so good.

"This paper seeks agreement to the scope and process of a review of the New Zealand Emissions Trading Scheme (NZ ETS). This review is in response to Cabinet’s decision to prioritise gross emissions reductions in New Zealand’s first emissions reduction plan (ERP), and Cabinet’s in-principle decision to at agree to the Climate Change Commission’s recommendations to strengthen the incentives for gross emissions reductions in the NZ ETS."

The fourth paragraph states;

"Enabling a just transition to a low-emissions, climate resilient future is a Government priority..."

Okay. I am all for a just transition. I'd like the transition to help those with low incomes instead of being corporate welfare for emissions intensive industry as in the case of the dreaded industrial allocation.

Back to the Cabinet paper. Who is being mean to the emissions trading scheme saying it needs more reform? It's the naughty He Pou a Rangi/Climate Change Commission. The Cabinet paper says in paragraph 50 that:

"In their 2021 advice, the Commission highlighted the risk that the NZ ETS would drive relatively low-cost net emission reductions through exotic forests, rather than gross emissions reductions needed to put us on track to net zero by 2050".

For emissions nerds who have tracked the emissions trading scheme since it's inception in 2007, this isn't just a future risk. It is exactly what has already happened in the 2008 to 2012 period of the Kyoto Protocol. Gross emissions rose in proportion to economic growth but "Net Kyoto" emissions (that included "afforestation and reforestation" sequestration credits that were not in the 1990 baseline) were less than the baseline.

This was before the fraudulent hot air emission units from Russia and Ukraine flooded into New Zealand. Here is Geoff Simmons in the Spinoff.

The Cabinet paper continues with a lot of background to the emissions trading scheme that is probably unnecessary. For example its not like Chris Hipkins would read that. He couldn't remember any details of other Cabinet papers where policies had consequences measurable in emissions.

Finally, I got to paragraph 79 on page 11. Maybe the officials who wrote the paper would finally mention where they see this reform proposal going. That would be new information. For example, what do the officials think are the possible high level options for amending the emissions trading scheme? Great, they are going to say what they think. Here is paragraph 79.

"However, in my view there is value in identifying some of the potential, high-level options Ministers may be presented as an output of the review. This will help give a sense of the kinds of options that could support balancing gross and net emissions reductions in the NZ ETS."

I turned the page expecting to be mildly enlightened. Okay that is sarcasm. It would have been nice to learn something new though.

This is paragraph 80. And 81 and 82.

Yes the potential, high-level options have been redacted! The whole point of downloading and reading the Cabinet paper was really to find out the possible options or new directions for dealing with known problems.

I kept plowing my way through the paper. Several pages are dedicated to the peculiarities of the inter-departmental 'process' to be followed. Remember the emissions trading scheme involves several government departments: principally Ministry for the Environment on policy, but also the Environmental Protection Authority for operating the emissions trading scheme, the Ministry for Primary Industries for foresty, MBIE for energy sector emissions and Ministry of Foreign Affairs and Trade for international climate agreements.

These departments interact in accordance with the their own perceptions of relevant interests. I add the observation that such interactions may not be in the direction of 'no more than 1.5C warming' or 'net zero carbon by 2050. The Cabinet paper leaves that unsaid.

However, such interactions are implicit as on page 14 paragraph 100, as the paper proposes some 'governance terms of reference' to presumably make the public servants play nicely.

I am reminded of the italian novelist Umberto Eco's explanation of the behaviour of the crusading Knights Templar religious order. The historic reality of knightly behaviour in the Holy lands was best understood by considering the order's offical commandments. For example, "thou shall not be drunk on a horse blaspheming the name of the Lord" was in fact the proof that such behaviour was the rule and not the exception.

So yes I am mildly interested in the 'governance terms of reference'. Here are the relevant paragraphs.

Yes the 'governance terms of reference' have been fucking redacted!

So I logged onto FYI.org.nz, the online transparent and open portal for requesting official information from public agencies. And I requested a complete copy of the Cabinet paper with all 26 redactions restored all their improbable glory. The 26 redactions are probably not earth-shatteringly egregious but the point of principle is - do there need to be any redactions if the Government is pursuing emissions policies consistently with their own professed value statement of a "just transition"?

I was so mad about that point that I started writing an email to Minister for Climate Change James Shaw asking him that exact question. The email turned into a three page letter. Oh well, push the send button, and try not to forget what the issue was when I finally get a reply after waiting a month or two for a reply. Of course, the same proviso applies to my Official Information Act request at FYI.org.nz. The Ministry may well extend the timeframe, or transfer the request to the Minister's office, or just ignore the timeframe - or a combination of all three.

Of course, in terms of climate change policy responses, we don't have time for this shit.

06 February 2023

Kyoto Protocol carbon prices 2005 to 2015 used by New Zealand's Ministry for the Environment

Perhaps the first data set of New Zealand carbon prices was the Ministry for the Environment's carbon prices used to calculate New Zealand's net position (either financial asset or liability) under the Kyoto Protocol.

The Ministry for the Environment had a web page About the 2008-2012 net position under the Kyoto Protocol

There was also a web page providing the Latest update on New Zealand's net position.

The net position was updated monthly in the crown financial statements for New Zealand issued by Treasury. A monthly data set of carbon prices was needed. From 2005, international carbon prices from either the United States ($USD) or Europe (euro) were converted to New Zealand dollars using the relevant foreign currency rate.

Another web page displayed the historic updates of the Kyoto Protocol financial information in the form of a table of eight columns. The seventh column was the carbon price in New Zealand dollars.

Here is what the table looked like.

Some years ago I saved an html file of that web page. I read the html file into R and tidied it into a data set with one row for every month and seven columns of variables. I even made a couple of charts!

In 2017, the Ministry for the Environment redesigned their website and the net position pages and the data set disappeared. I had thought about preserving it for the public record. I didn't get around to it.

I have just noticed I still have a folder of my R analysis. So I created a Github repository called Historic updates of the Kyoto Protocol carbon price. This now records the original .html file, some R script, the tidied data as a .csv file, a 'Readme' file and some charts.

I updated my chart!

I can't remember how I chose the colour of the line. It's "#D2691E" or "hot cinnamon".

What key point does the chart make?

The international market was flooded with "hot air" emission units from 2011. As the Morgan Foundation report Climate Cheats sets out.

One type of Kyoto carbon credit (the Emission Reduction Unit) was overcome by fraud and corruption in Ukraine and Russia. Virtually all of the credits issued by these countries are ‘hot air’ – they do not represent true emissions reductions. (Chapter 2)
Proportional to our emissions, New Zealand has been by far the largest purchaser of these Ukrainian and Russian credits through our Emissions Trading Scheme. This was due to deliberate decisions by the National-led Government to – unlike any other country – continue allowing unlimited use of these and other foreign credits for as long as the international community let us. (Chapter 3)
This fraud has had several nasty side-effects: It sent the price of carbon units in our Emissions Trading Scheme (ETS) to virtually zero, hammering our nascent carbon forestry industry.

07 December 2022

Industrial over allocation - why were there 55 million free emission units when total industry sector emissions were 53 million tonnes?

How does it make any sense that the 55 million free emission units gifted to big emitters under Industry Allocation exceed the total emissions of the industry sector, 53 million tonnes, from 2010 to 2020?

In my last post I noted that 55 million free emission units had been allocated to industries over the eleven years from 2010 to 2020.

I presented a barplot of the 'Industrial Allocation' of free emissions units given to emitting industries by the Environmental Protection Authority under the New Zealand emissions trading scheme.

I left open the question "is 55 million free emission units (over eleven years) a big number?"

The Ministry for the Environment doesn't seem to think so. Their website page on Industrial Allocation states the following

Industrial allocation contributes to unit supply in the NZ ETS

Industrial allocation is a relatively small proportion of unit supply in the NZ ETS. In 2016, the total number of units provided through industrial allocation in the NZ ETS was 4.3 million.

The total number of units surrendered from sectors other than forestry was 19.5 million (i.e. industrial allocation amounted to about 22 per cent of annual unit demand).

I call this the consultants fallacy. It has the form "put small number next to big number" and therefore "effects are minor" and grant me my resource consent.

You have a number you wish to defend; 4.3 million free units allocated in 2016. You compare it to a related bigger number; in 2016 emitters surrendered 19.5 million emission units under the emissions trading scheme. Premises then conclusion: 4.3 million is smaller (only 22 per cent of) than 19 million. A relatively small proportion therefore it's a small number of units being given away for free to dirty polluting emitters.

Wouldn't the actual emissions from the industry sector as recorded in the Greenhouse Gas Inventory be a better comparion with the actual free allocation of units? The inventory tells us the actual emissions from industries were 4.6 million tonnnes in 2016.

How does that fit with my theory that industrial allocation is over allocation? Fewer units were allocated (4.3m) than the 2016 actual industry emissions! (4.6mt) Well at least 300,000 tonnes of industry emissions were in some sense 'priced' by the emissions trading scheme in 2016.

What's the result if we add up the inventory emissions from industry for the same period as the Industrial allocation spreadsheet from the EPA (11 years 2010 to 2020).

The result is that the industry emissions (from the inventory) were 53 million tonnes and the emissions units given away under Industrial Allocation were 55 million.

So to make it simple. The emissions trading scheme makes New Zealand industry liable to surrender emissions units for it's emissions.

Okay we get it. It's "polluter pays". But the Industrial Allocation rules have given some industries more emission units than the emissions of the entire industry sector! It's almost equivalent to exempting the whole industrial sector from the emissions trading scheme.

But it's worse than that. The allocations of emissions units are heavily weighted towards the highest quantity emitters. The top ten recipients received 89% of the units. The other 152 recipients got 11% of the units. New Zealand Aluminium Smelters Limited and New Zealand Steel Limited received about 45% of all the allocated free units.

There is a little bit more to tease out. I will put that in a separate post.

17 September 2021

Moving the deckchairs on the Titanic - the Ministry for the Environment's pathetic incremental reforms of industrial allocation in the NZ emissions trading scheme

The Ministry for the Environment is running a consultation on reforming industrial allocation in the NZ ETS. It closes for submissions today.

Industrial allocation is the process where large trans-national emitters who have to surrender emissions units under the emissions trading scheme (that being the whole point of an ETS) are 'allocated' (given) free emissions units.

Remember that an emissions unit is the legal right in the form of a transferable permit to emit greenhouse gases. They are just like petrol vouchers. Or like a voucher to burn coal or a voucher to emit methane.

The units say in effect "the owner of this unit has the absolute right and permission to burn some fossil fuel, a tonne of carbon dioxide equivalent emissions per unit". So every emission unit allocated to an emitter says to those emitters just go burn some carbon.

The process doesn't just reduce the carbon price. It makes it a wealth transfer and therefore a carbon refund.

New Zealand Steel Ltd and New Zealand Aluminium Smelters Ltd are allocated more emission units than they need to surrender. The net effect of industrial allocation is that the two trans-national high-emitting companies have been net sellers of emissions units in every year of the emissions trading scheme since 2010.

After nine years of National Government amendments to the emissions trading scheme, the industrial allocation settings were basicly "free over allocation of emissions units to emitters for ever"

Since 2017 the Minister for Cimate Change James Shaw and the Ministry for the Environment have made one pathetically minor tweak to the industrial allocation settings. The eternal and un-ending entitlement to free units will decline by 1% a year from 2020.

Now the latest consultation proposes refining some of the minor detail of the baselines used for industrial processes that have the privilege of being eligible for industrial allocation free unit giveaway

I have just sent in my submission. So here it is. I argue a couple of basic points. There is a climate emergency. The only issue that matters is to rapidly reduce NZ's emissions of greenhouse gases. But MfE proposes incremental tweaks to industrial allocation settings in the ETS. This is just moving the deckchairs on the Titanic.

The industrial allocation rules should not be refined, they should be abolished. They have no place in an ETS designed to rapidly reduce emissions. I state that the only Government policy programme for reducing emissions that is worse than the ETS is the incremental process to reform the ETS

Submission to Ministry for the Environment on Reforming industrial allocation in the NZ ETS 17/09/2021

The world is facing a climate emergency. According to the IPCC Sixth Assessment Report (WG1), in order to limit warming to 1.5C with no or a limited overshoot, net global carbon dioxide emissions need to fall by 45% from 2010 quantities by 2030 and to then achieve net-zero emissions by 2050.

Given that urgency, the only issue or question that matters for emissions reduction policy is “does it reduce anthropogenic emissions of greenhouse gases rapidly and effectively”?

Based on that criteria, the New Zealand emissions trading scheme (NZETS) completely fails as a policy. The only other NZ Government policy programme that also fails to this same catastrophic extent is - the Ministry for the Environment’s current process of incrementally amending minute details of the NZETS. This consultation is no exception.

Therefore I disagree with and completely reject the minimalist scope of this consultation. I am deliberately going outside the scope of the consultation as the Ministry needs to be called out for this inadequate and frankly egregious approach.

When the critical and urgent need is for policies that rapidly reduce emissions of greenhouse gases, proposals such as this consultation for minimalist incremental changes to the deeply flawed industrial allocation rules are merely “rearranging the deckchairs on the Titanic”.

I am appalled that officials have proposed such limited policy actions that are so obviously not commensurate with the magnitude and severity of the climate emergency. I am appalled that the Government and the Minister have allowed this pathetically incremental approach.

I consider it is well understood what is wrong with the NZETS industrial allocation policy. I will list a few points.

  • The industrial allocation results in the gross overallocation of emissions units to emitters,
  • It is a process that assumes existing allocations are property rights of emitters,
  • There is an implicit assumption that existing allocations have some logical basis in good policy rather than it being the result of vested interest political lobbying and compromise,
  • There is no fixed cap on emissions because of production-based allocation of emission units,
  • The baselines show no logical relationship to the established IPCC emissions factors used in the Greenhouse Gas Inventory reporting and unit surrenders,
  • The baselines include the Electricity Allocation Factor - which is an empirically invalid proxy for unverified and unproven energy and electricity pass-through costs,
  • Major industrial emitters such as NZ Steel and NZ Aluminium Smelters Ltd are net sellers of units as they receive so many free emissions units,
  • Units are allocated to non-participants of the ETS who have no surrender obligations (the hothouse horticulture sector),
  • The 30-year timeline of incremental 1% or 2% or 3% annual phase-out of allocations is completely inadequate as an emitter could maintain the same allocation of units, despite the 1% phase down, by simply producing more output each year.

In summary, the New Zealnd Emissions Trading Scheme is grossly deficient to the extent that it deviates from a simple and transparent design of a capped number of emission units applied without exception across all relevant economic sectors as in the Greenhouse Gas Inventory - with units to be surrendered by emitters with no free allocation.

Recommendations

The first-and-best policy recommendation I wish to make is that; "industrial allocation of free emission units should be immediately terminated".

The second best policy recommendation I would make is that “all industrial allocation of units is phased out within three years or a similar very short timeframe (much as the "two-for-one" units surrender discount was phased out from 2017 to 2019).

The third best policy recommendation I would make is that “any short-term industrial allocation of units must immediately exclude energy costs (the EAF) so that no emitters are net sellers of units under industrial allocation”.

The fourth best policy recommendation I would make is that “if there is a limited and short term period of rapid phase out of industrial allocation, and if baselines are validly needed, then the emissions baselines used should be the relevant emissions factors from the Greenhouse Gas Inventory”.

Consultation questions

Question 1: Do you agree with the five criteria to assess the proposals in this consultation document? Why, or why not?

I strongly disagree with the criteria. This sort of policy minutiae is rearranging the deckchairs on the Titanic. The first best policy is elimination of free industrial allocation of units over the shortest time period possible.

Question 2: Should allocative baselines be updated using new base years? Why, or why not?

I strongly disagree. This sort of policy minutiae is rearranging the deckchairs on the Titanic. When allocations are being eliminated as rapidly as possible, it will be irrelevant what baseline is used. Grandparenting allocations will be adequate if the public can see that all free allocation will end in the short term e.g. over three years.

Question 3: Should the reassessment be a one-off update, or a periodic update? Why, or why not?

I strongly disagree. Reassessment is completely pointless. It is rearranging the deckchairs on the Titanic. The first best policy is elimination of free industrial allocation of units over the shortest time period possible.

Question 4: If periodic reassessment is legislated, what would be an appropriate period – every year, 5 years, 10 years, or something else? Why?

I strongly disagree. Periodic reassessment is completely pointless. It is rearranging the deckchairs on the Titanic. The first best policy is elimination of free industrial allocation of units over the shortest time period possible.

Question 5: Do you agree the financial years 2016/17, 2017/18 and 2018/19 should be used as new base years to update allocative baselines? Why, or why not? I strongly disagree. This is completely pointless. It is rearranging the deckchairs on the Titanic. The first best policy is elimination of free industrial allocation of units over the shortest time period possible.

Question 6: Should the financial years 2019/20 and 2020/21 be included, but with a weighting provision? Why, or why not?

I strongly disagree. This is completely pointless. It is rearranging the deckchairs on the Titanic. The first best policy is elimination of free industrial allocation of units over the shortest time period possible.

Question 7: Should eligibility be reassessed using new base years?

I strongly disagree. This is completely pointless. It is rearranging the deckchairs on the Titanic. The first best policy is elimination of free industrial allocation of units over the shortest time period possible.

Question 8: Should new emissions intensity thresholds for New Zealand industry be developed? Why, or why not?

Strongly no. Developing new thresholds is completely pointless. It is rearranging the deckchairs on the Titanic. The first best policy is elimination of free industrial allocation of units over the shortest time period possible.

Question 9: Should more thresholds be added into the eligibility criteria? Why, or why not? How many would be appropriate?

I strongly disagree. This is completely pointless. It is rearranging the deckchairs on the Titanic. The first best policy is elimination of free industrial allocation of units over the shortest time period possible.

Question 10: Would a sliding scale threshold system better target eligibility and assistance? Why, or why not?

I strongly disagree. This is completely pointless. It is rearranging the deckchairs on the Titanic. The first best policy is elimination of free industrial allocation of units over the shortest time period possible.

Question 11: Should the New Zealand EAF be used when determining eligibility? Why, or why not?

I strongly disagree. The first best policy is elimination of free industrial allocation of units over the shortest time period possible. Even if there is retention of allocation for a short period, the EAF should be immediately abolished so that no emitter receives more units than they are required to surrender.

Question 12: Should periodic updates of the EAF trigger a recalculation of eligibility? Why, or why not? I strongly disagree. This is completely pointless. It is rearranging the deckchairs on the Titanic. The EAF should be abolished and not included in any very short phase-out term. If industrial allocation is to continue for even a short term, the rules must ensure no emitter is a net seller of units after allocation.

Question 13: Should the trade exposure test be changed? Why, or why not?

I strongly disagree. This is completely pointless. It is rearranging the deckchairs on the Titanic. The trade exposure test should be abolished even if industrial allocation continues for a very short limited period.

Question 14: What would be a more appropriate method to determine trade exposure?

This is completely pointless. It is rearranging the deckchairs on the Titanic. The trade exposure test should be abolished.

Question 15: Do you agree with the proposal to simplify the process to update allocative baselines, to reflect changes to emissions factors, EAF or other changes to methodology? Why, or why not?

I strongly disagree. This is completely pointless. It is rearranging the deckchairs on the Titanic. In the context of the need to rapidly phase out allocation (if not immediate cessation) there is no point updating baselines. The EAF should be abolished and not included in any very short phase-out term. If industrial allocation is to continue for even a short term, the rules must ensure no emitter is a net seller of units after allocation.

Question 16: Are there other changes to sections 161A-E of the Act that could better streamline IA processes?

It is absolutely too late to be ‘streamlining’ sections 161A-E of the Act. All sections of the Climate Change Response Act providing for free allocation should be repealed.

Question 17: Do you agree with the proposal to clarify the eligibility process for new activities? Why, or why not?

I strongly disagree. Free industrial allocation should be terminated as quickly as possible. No new entrants should be permitted.

Question 18: Should new activities be able to seek eligibility? Why, or why not?

I strongly disagree. Free industrial allocation should be terminated as quickly as possible. No new entrants should be permitted.

Question 19: Should there be any caveats on new activities seeking eligibility, such as proof of environmental benefits compared to existing activities?

Free industrial allocation should be terminated as quickly as possible. Future eligibility should be irrelevant. No new entrants should be permitted.

Question 20: Should firms that receive IA be required to report their emissions, revenue and production data annually? Why, or why not?

Yes. And unit surrenders should be reported. That is simple transparency and good governance of a market. It speaks volumes as to the inadequacy of the NZETS and it’s lack of transparency that firms receiving industrial allocation have not to date been required to report their emissions, revenues and production data.

Question 21: Would voluntary reporting be more appropriate, and still provide some oversight of leakage and over-allocation risk? Why, or why not?

I strongly disagree. That would be an abuse of transparency. That is the opposite of oversight.

Question 22: Should the five-year transition period for changes in eligibility status remain, or be changed? Why, or why not?

This is completely pointless. A five year period for changes in eligibility is a nonsense in the context of a rapid phase out of allocation. It is rearranging the deckchairs on the Titanic. The first best policy is elimination of free industrial allocation of units over the shortest time period possible.

Question 23: Should we look at an alternative mechanism to address emissions leakage? Why, or why not?

No, this is completely pointless. "Emissions leakage" is just the NZ Initiative policy of "fast follower" (e.g. climate policy laggard) dressed in sheep's clothing. Emissions leakage should be irrelevant now that the world has a universally agreed international treaty - the Paris Agreement - to reduce emissions to net zero near 2050. Under the Paris Agreement NZ is only responsible for its own emissions. Other countries are responsible for their sovereign emissions.

Question 24: What alternative mechanisms to IA would better address the risk of emissions leakage, and support domestic and international emissions reduction targets?

Emissions leakage should be irrelevant now that the world has a universally agreed international treaty - the Paris Agreement - to reduce emissions to net zero near 2050. Under the Paris Agreement NZ is only responsible for its own emissions. Other countries are responsible for their sovereign emissions.

Question 25: Should IA policy or any alternative explicitly encourage firms to reduce emissions? Why, or why not?

Frankly, given the state of the climate emergency, I can’t even understand why Ministry officials would even ask that question in a NZETS consultation. Reducing emissions is the only point of emissions trading.

Question 26: What method could be used to encourage emissions reductions?

A well designed, capped, no-industrial-allocation, all sectors all-auctions NZETS would encourage emissions reductions.

Question 27: Should IA decisions or any alternative include wider considerations – such as economic, social, cultural and environmental factors – when determining support for industry? Why, or why not?

No, absolutely not. Why on Earth would NZETS policy be based on any criteria other than reducing emissions? NZ has had 10 years of "wider considerations" in the NZETS and the result has been excessive wealth-transferring free industrial allocation to emitters. Effective policy incentivising rapid reduction in emissions must start immediately.

Question 28: How would these new considerations interact with the goal of reducing emissions leakage?

Honestly, this is ridiculous. See previous comment.

Question 29: Do you have any other comments, ideas or critical feedback that could help support the Government form final policy decisions?

Just to repeat. The world is facing a climate emergency. According to the IPCC Sixth Assessment Report (WG1), in order to limit warming to 1.5C with no or a limited overshoot, net global carbon dioxide emissions need to fall by 45% from 2010 quantities by 2030 and to then achieve net-zero emissions by 2050.

Given that urgency, the only issue or question that matters for emissions reduction policy is “does it reduce anthropogenic emissions of greenhouse gases rapidly and effectively”?

Based on that criteria, the New Zealand emissions trading scheme (NZETS) completely fails as a policy. The only other NZ Government policy programme that also fails to this same catastrophic extent is - the Ministry for the Environment’s current process of incrementally amending minute details of the NZETS. This consultation is no exception.

Therefore I disagree with and completely reject the minimalist scope of this consultation. I am deliberately going outside the scope of the consultation as the Ministry needs to be called out for this inadequate and frankly egregious approach.

When the critical and urgent need is for policies that rapidly reduce emissions of greenhouse gases, proposals such as this consultation for minimalist incremental changes to the deeply flawed industrial allocation rules are merely “rearranging the deckchairs on the Titanic”.

I am appalled that officials have proposed such limited policy actions that are so obviously not commensurate with the magnitude and severity of the climate emergency. I am appalled that the Government and the Minister for Climate Change Issues have allowed this pathetically incremental approach.

25 March 2018

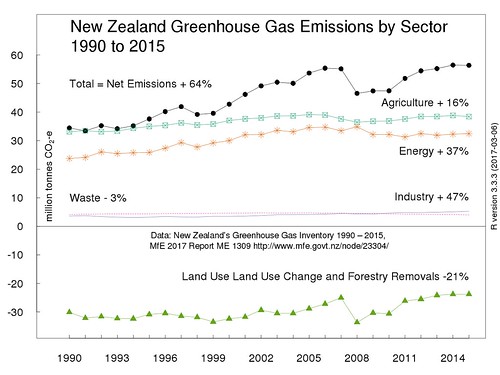
Charting New Zealand Greenhouse Gas Emissions by Sector 1990 to 2015

I have created a revised chart of New Zealand's greenhouse gas emissions analysed by economic sector for the years from 1990 to 2015. Something I have done before. Before that I made a chart of just the gross and net emissions.

This first image is an uploaded .png file at actual size (560 pixels wide) which is the width of the text container in the blog's template.

For a comparison, this second image uses Flickr's embed code to show a larger file (1280 pixels wide) I uploaded to Flickr. It's not a very large file; 128 kilobytes. That seems minute, when I am uploading 4MB or larger photographs to Flickr. If I wanted a larger file, I could output the chart from R as a .tiff format file.

NZ-Net-ghg-sector-2015-1280box

The first smaller image uploaded to Blogger seems slightly clearer.

The data source is of course;

"New Zealand's Greenhouse Gas Inventory 1990–2015", Publication date: May 2017, Publication reference number: ME 1309, Full report - New Zealand’s Greenhouse Gas Inventory 1990-2015, and supporting tables and files. CRF summary data [Excel file, 45.6 KB]

The key difference from previous charts is that I have omitted gross emissions or as the Ministry for the Environment calls them "Gross emissions without Land Use, Land Use Change and Forestry (LULUCF)". Gross emissions frequently if not mostly seem to be the focus of analysis of trends and achievement of targets. Land Use, Land Use Change and Forestry emissions frequently get omitted.

I started with the sector emissions, then I added net emissions. Net emissions are the sum of the sectoral emissions obviously. Net emissions (with a qualification I may address in another post) are what end up in the atmosphere. So from a science-informed viewpoint, analysis of trends should be based on net emissions.

What struck me is that this format highlights a different interpretation of trends. Look how much of NZ's 1990 emissions were 'counter-balanced' by Land Use, Land Use Change and Forestry. In 1990, the land use and forestry sector sequestration (removal) of greenhouse gases was equivalent to the sum of the other sectors excluding agriculture. The 1990 net emissions were the same as the emissions from the agriculture sector. In other words, if you excluded agriculture emissions, NZ's emissions in 1990 would have been 'net zero'.

Since 1990, the land use and forestry sector sequestration has declined by 21%. In 1991, the land use and forestry sector sequestration 'counterbalanced' 100% of non-agriculture emissions. In 2015, the land use and forestry sector sequestration only counterbalanced only 57% of non-agriculture emissions. As long as land use and forestry sequestration is measured consistently over time, this trend can only get worse. A lot of commercial forest planting happened in the 1990s. These forests will soon be due for harvesting. That's why I want to scream each time I hear some pundit say forestry will be a 'get out of jail card' for growing emissions in other sectors, notably agriculture.

Here is the R script (with a couple of Linux Xterminal commands) for obtaining and preparing the data and for creating the chart.

22 July 2017

The slow road to getting open data from the Government's Clean Water 2017 water quality monitoring sites

Who remembers the National Government's consultation over it's proposed Clean Water package 2017?

Who remembers the headline announcement of the proposal? - that there would be a 'target', that 90% of rivers and lakes would be swimmable by 2040?

The environmental NGOs were very critical of the target (and the proposal as a whole).

The Green Party said the new swimmable standard was just shifting the goalposts.

Forest & Bird's Kevin Hague described the proposal as a reduced swimmability standard.

Marnie Prickett of the Choose Clean Water group described the proposal as "fraud" as it intended to change the definition of swimmable to meet a lower standard.

The environmental NGO's argument was that the new proposed 'risk' standard for swimming (expressed in E Coli as an indicator of faecal matter and pathogens) allowed a one in a twenty probability of getting sick when the old standard was a much more precautionary one in a hundred probability of getting sick.

Dr Siouxsie Wiles and Dr Jonathan Marshall explained that the change in risk wasn't quite as simple as that. As did University of Auckland Professor of Biostatistics Thomas Lumley.

However, I thought there was something wrong with that 90 percent number. I seemed to recall Green MP Eugenie Sage saying in 2014 that more than 60 percent of the monitored river swimming sites were unfit for swimming.

The Clean Water package 2017 included this barchart which shows that the 90% 'swimmable' target (and five new swimming quality categories from 'excellent' to 'poor') are actually expressed in a different variable: length of river measured in kilometres (not in number of monitoring sites).

It also shows, in the left-most bar, that the use of the use of the 'length of river' variable in place of numbers of river monitoring sites, results in a very different result.

On the basis of recent data, 72 percent of kilometres of rivers currently meet the 'swimmable' standard (the sum of the 'Fair', 'Good' and 'Excellent' quality categories. Expressing the results in kilometres of river lengths and not in numbers of sampling sites immediately enables a more positive spin to be put on the results.

The underlying data must be water quality sampling results from NIWA's National Rivers Water Quality Network (NRWQN) and sites operated by regional councils.

So, way back on 15 March 2017, I asked for the underlying sampling data from the water quality monitoring sites.

I felt I had expressed my official information request sufficiently clearly to get a reply in a reasonable time.

On your website on the page "Clean Water package 2017" there is a bar chart explaining the target of 90% of rivers and lakes swimmable by 2040 included in the report "Clean Water, ME 1293". The bar chart is also on page 11 of report "Clean Water, ME 1293". The bar chart shows kilometres (which I assume are lengths of segments of rivers) in each of the five 'quality' categories (Poor, Intermittent, etc) with a time variable which has three bars; "Current", "2030" and "2040".

Will you please provide me with the underlying data; which I assume must be water quality monitoring site results (and future predictions for 2030 and 2040) analysed by the five quality categories and the three time categories "Current", "2030" and "2040". Will you also please include the name or number of each monitoring site, its region and for the "Current" selection, the sampling period for the actual E Coli counts. Please provide this data either in comma separated values or Excel 2007 format via the FYI website.

However, I had to lodge a complaint with the Office of the Ombudsmen to eventually obtain the data. That only happened after the investigator from the Office of the Ombudsmen brokered a deal with the Ministry for the Environment. He rang me and said that the Ministry didn't want to give me the data in either .csv or .xls format as I'd requested as the data was in a special binary format; .rdata, specific to a certain statistical programming language named after the letter 'R'.

In other words, it appeared to me the Ministry were claiming that a 'technical' problem in providing me the data I had requested, and not a problem of intent to frustrate the information request.

Sure, it's fair enough to take the Ministry at their word that they didn't intend to delay and frustrate my request. However, whatever the intention, it was still a delay from my point of view as the requester.

I told the investigator I would be happy to get the data in .rdata format. I also expressed the view that it would have only been a very short line of 'R' script to convert the .rdata formatted file into .csv format. And that it was a weak reason for the delay and for not providing me the data in .csv format. I observed that the Ministry's response was pretty unsatisfactory from an open data perspective. The investigator said he couldn't comment on open data issues, as we were in an official information space.

I was finally emailed the data in .rdata format by the Manager, Executive Relations, on 5 July 2017.

I used this R script;

to write the .rdata file to a .csv file.

The .rdata file is WQdailymeansEcoli.rdata at Google Drive.

The .csv format file is WQdailymeansEcoli.csv at Google Drive.

Now I just need to find the time to analyse the sampling sites data.

17 June 2017

New Zealand greenhouse gases by sector from the inventory

I have made another chart from the New Zealand's Greenhouse Gas Inventory 1990–2015 released the other week by the Ministry for the Environment.

It shows the greenhouse gas emissions by sectors of the economy. It includes 'negative' emissions, more properly called carbon removals, or carbon sequestration or simply carbon sinks. This is the sum of all the carbon dioxide taken out of the atmosphere by the sector of the economy called Land use, Land use change and Forestry.

Here is the chart.

This time I took a more traditional R approach to getting the the data into R from the Excel file CRF summary data.xlsx.

First, I used opened an X terminal window, and used the Linux wget command to download the spreadsheet "2017 CRF Summary data.xlsx" to a folder called "/nzghg2015".

I then used ssconvert (which is part of Gnumeric) to split the Excel (.xlsx) spreadsheet into comma-separated values files.

The Excel spreadsheet had 3 work sheets, 2 with data, and 1 that was empty. So there's now a .csv file for each sheet, even the empty sheet. And we read in the .csv file for emissions by sector.

The final step is to make the chart.

06 June 2017

The latest inventory of New Zealand's greenhouse gases

On the Friday before last Friday, the 26 of May 2017, Minister for Climate Change Issues, Paula Bennett and the Ministry for the Environment released the latest inventory of New Zealand's greenhouse gases.

Minister Bennett and the Ministry have as their headline Greenhouse gas emissions decline.

I thought would I whip up a quick chart from the new data with R.

I pretty much doubted that there was any discernible decline in New Zealand's greenhouse gas emissions to justify Bennett's statement. We should always look at the data. Here is the chart of emissions from 1990 to 2015.

Although gross emissions (emissions excluding the carbon removals from Land Use Land Use Change and Forestry (LULUCF)) show a plateauing since the mid 2000s, with the actual gross emissions for the last few years sitting just below the linear trend line.

Gross 2015 emissions are still 24% greater than gross 1990 emissions.

For net emissions (emissions including the carbon removals from Land Use Land Use Change and Forestry) the data points for the years since 2012 sit exactly on the linear trend line. Net 2015 emissions are still 64% greater than net 1990 emissions.

There was of course more data wrangling and cleaning than I remembered from when I last made a chart of emissions!

The Ministry for the Environment's webpage for the Greenhouse Gas Inventory 2015 includes a link to a summary Excel spreadsheet. The Excel file includes two work-sheets.

One method of data-cleaning would be to save the two work sheets as two comma-separated values files after removing any formatting. I also like to reformat column headings by either adding double-speech marks or by concatenating the text into one text string with no spaces or by having a one-word header, say 'Gross' or 'Net'.

Of course, that's not what I did in the first instance!

Instead, I copied columns of data from the summary Excel sheet and pasted them into Convert Town's column to comma-separated list online tool. I then pasted the comma-separated lists into my R script file for the very simple step of assigning them into numeric vectors in R. Which looks like this.

Then the script for the chart is:

The result is that the two pieces of R script meet a standard of reproducible research, they contain all the data and code necessary to replicate the chart. Same data + Same script = Same results.

I also uploaded the chart to Wikimedia Commons and included the R script. Wikimedia Commons facilitates the use of R script by providing templates for syntax highlighting. So with the script included, the Wikimedia page for the chart is also reproducible. Here is the Wikimedia Commons version of the same chart.

NZ-ghg-2015

For comparison, here is my equivalent chart of greenhouse gas emissions for 1990 to 2010. Gross emissions up 20% and net emissions up 59%.

What can I say to sum up - other than Plus ça change, plus c'est la même chose.

28 September 2016

Opening up the Ministry for the Environment data and webscrape the 2015 free allocation of emission units

Let's look at the latest data on the very generous free give-aways of emissions units to emitters made by the New Zealand Ministry for the Environment
N.B. Update on 10 December 2016. The allocation decisions have moved to the web page of the Environmental Protection Authority
.

The Environmental Protection Authority now hosts the 2015 Industrial Allocation Decisions that show the final free allocation of emission units to emitters for 2015 under the New Zealand Emissions Trading Scheme.

The New Zealand Ministry for the Environment no longer hosts the unit allocation data and the old link returns an Acess Denied page.

I looked at the 2010 to 2014 data in my post Opening up the data on emissions units in the NZ emissions trading scheme. So in this post I am will repeat my steps in web-scraping the freebie emissions unit data into a sensible open-data format (but with the links updated to the EPA).

The url of the old Ministry for the Environment web page is http://www.mfe.govt.nz/climate-change/reducing-greenhouse-gas-emissions/new-zealand-emissions-trading-scheme/participatin-4

The url of the EPA web page is http://www.epa.govt.nz/e-m-t/taking-part/Industrial-allocations/allocations-decisions/Pages/decisions-2010.aspx. And unfortunately, the Google sheet 'scrape the table' script does not seem to work with the EPA page.

Go to Google and open a new Google sheet.

Following the tip from the School of Data Liberating HTML Data Tables, enter this text in cell A1 of the Google sheet.

=importHTML("","table",1)

Add the url of the Ministry for the Environment's free allocation web-page between the double speech marks so you have this exact text in cell A1.

=importHTML("http://www.mfe.govt.nz/climate-change/reducing-greenhouse-gas-emissions/new-zealand-emissions-trading-scheme/participatin-4","table",1)

It was good thing that I kept a screen shot to show that it worked perfectly! We now have a Google sheet of the 2015 free unit allocation to NZ emissions trading scheme emitters.

I have saved it as NZETS-2015-final-allocations-for-eligible-activities.

However, the data does not have a "tidy" structure, where each variable is a column and each observation is a row (Wickham, Hadley . "Tidy Data" Journal of Statistical Software [Online], Volume 59, Issue 10 (12 September 2014)).

The first column includes both industry names and types of industries classified by the type of emissions the industry produces. And lots of asterisks. A tidy format would have these attributes (or variables) as separate columns so that each company/emitter would have a row each.

I used a programme called Open Refine (which is also at Github) to data-wrangle the data into tidy format and to save it as a comma-separated values file which is this Google sheet NZETS-2015-final-allocations-for-eligible-activities. Its a bit fiddly using Open Refine, and I have not documented the steps. I won't describe how I did it. Yes, I know, from the point of view of reproducing the tidied data I should have done the tidying with a script or code. Next time I will.

As usual, the big emitters get the most emission units! Of 4.417 million units allocated to industries, 90% went to 11 large companies. New Zealand Steel Development Limited, of arbitrage profits fame, gets 1,067,501 free units. New Zealand Aluminium Smelters Limited gets 772,706 free units.

This is the updated free emission unit allocation data from 2010 to 2015.

I did a bit of data visualising with the 2015 data and created this pie-chart in R programming language.

The R script for that is:

Did I not get the End the Rainbow memo? So I picked a better colour scale from Colour Brewer.

The R script for this non-rainbow pie chart is:

11 September 2016

The Ministry for the Environment's disavowed orphan carbon budget

Did you know that the Ministry for the Environment prepared a 'two degrees' carbon budget in 2014?

The relevant report "Potential long-term pathways to a low carbon economy for New Zealand", Wellington, Ministry for the Environment, August 2014, is not available from the Ministry's web page. However, I requested it from the Ministry via the 'For Your Information' website.

Incredibly, Idiot Savant had a blog post about it up at No Right Turn on Friday titled Climate change: No path to lower emissions under National before I had even updated the status of my Official Information Act request on FYI.

The paper explicitly sets out to explore a New Zealand carbon dioxide budget consistent with limiting eventual global warming to two degrees Celsius, using the contraction and convergence method.

Presumably because of that aim, the paper appears to have been completely disavowed by the Ministry for the Environment. The cover letter replying to my request at FYI states that the report is neither formal advice to the Government nor is it Ministry policy. The report has a header stating that it is 'sensitive' and 'Not Government or Ministry policy'. There is an italicised inserted 'Note' saying that Treasury does not agree that contraction and convergence is an appropriate measure of a 'fair share'.

The guts of the report are three carbon budgets (a 10th percentile, a median and a 90th percentile) based on applying contraction and convergence to one of the IPCC two degrees-consistent carbon budgets. Oddly, the working calculations and the actual budget amounts are omitted. I guess I can just make another request for them. The budgets are only presented in this graph.

21 October 2015

Environment Aotearoa 2015 omits NZ's greenhouse gas growth trend

The Ministry for the Environment and the Statistics Department jointly released the new state of the environment report Environment Aotearoa 2015 today.

The press release for the co-produced report, promises quite a lot.

Government Statistician Liz MacPherson said the report gives a clear and independent overview, based on the best-quality information available.
Ms MacPherson said the report uses robust data from hundreds of sources, and follows international best practice for environmental reporting. “We would like to improve the data for future reports, and we are working on this,”
"The report is supported by interactive web pages containing trend and regional data. I would encourage people to take a look at the areas they are interested in.”

Wow! Interactive web pages containing trend and regional data! How could I resist the temptation to look for some interactive graphs of greenhouse gas emissions! And to compare their graphs with my graphs.

I browsed on through the 'Atmosphere and Climate' domain to the page for Global greenhouse gas emissions and found only...information on global greenhouse gas emissions. And a factoid that could have culled from any speech by Tim Groser or Nick Smith.

Between 1990 and 2011, New Zealand emitted an average of 0.1 percent of global net GHG emissions.

I tried again at the page Greenhouse gas concentrations. This page reported concentrations of greenhouse gas emissions recorded at Baring Head. Interesting but still no national emissions data.

However, i did find a widget enabling the embedding of a graph the Baring Head atmospheric carbon dioxide data record.

Nowhere from anywhere within the Te Taiao Aotearoa environmental indicator web pages could I find any mention of New Zealand's gross and net greenhouse gas emissions.

I resorted to doing a search of the Statistics website for greenhouse gases. That did turn up a web page showing New Zealand's greenhouse gases. That page clearly reported the trend with a prominent red cross.

Negative change. New Zealand’s net greenhouse gas emissions have increased 42 percent since 1990. New Zealand’s net greenhouse gas emissions increased 42 percent between 1990 and 2013. Total emissions increased 21 percent.

Another widget for embedding. A very plain graph. It uses a different greenhouse gas inventory report published earlier this year from my graphs for 1900 to 2012. The data for 1990 to 2013 uses a different way of calculating the carbon dioxide equivalent values for methane. This increases the year by year values by several million tonnes per year.

Still it just seems so bizarre to have statutory environmental indicators and to not include our national production of greenhouse gases. Especially since Statistics already had the data on it's web page. They need only to have put the link in. Is this cognitive dissonance, self-censorship or climate silence?

16 January 2013

The Kyoto New Zealand break-up - when unfaithful New Zealand said 'commitment' he never meant it

In this post I argue the best analogy for New Zealand's choice to opt out of a second commitment period (of reducing emissions) under the Kyoto Protocol - is: unfaithful men who won't commit to their partners!

New Zealand governments have behaved faithlessly towards Kyoto. The current National Government under Climate Minister Tim Groser won't commit to the Kyoto Protocol stage 2. And the 1990s National Government gave a commitment they had no intention of being faithful to. New Zealand politicians and diplomats intentionally negotiated the Kyoto Protocol so that New Zealand's Kyoto target would be met without reducing either gross or net emissions of greenhouse gases

I have argued before that New Zealand did not sign the Kyoto Protocol in good faith. As we seem unable to commit to Kyoto stage 2 in good faith, I have had another look at how faithful New Zealand's position was right from the the beginnings of Kyoto Protocol negotiations and at ratification in 2002.

According to a UNFCCC account of the Kyoto negotiations 'Tracing the Origins of the Kyoto Protocol: An Article-by-Article Textual History' on page 48;

"New Zealand was the only Party which made an early, more comprehensive proposal on the treatment of sinks, suggesting that sequestration of greenhouse gases from certain listed categories should be added to a Party's emission budget" (paragraph 226)
"New Zealand...faxed through a proposal for the treatment of sinks...sinks would not be included in a Party's baseline, but removals would be credited to a Party's budget (the so-called 'gross-net' approach)." (para 227)

(NB 'Sinks' meaning forests or land-use or land-use-change that sequesters carbon dioxide from the atmosphere. So the New Zealand diplomats were 'ahead of the curve' in negotiating to get forest sinks recognised so they could offset other emissions.)

In October 1997,three weeks before the UNFCCC meeting in Kyoto, Simon Upton, the Minister for the Environment in Jim Bolger's National Government said in a speech:

"New Zealand has long been advocating" for Kyoto rules where "removing carbon from the atmosphere in future years will earn us credits"

Let's look at the advice the Ministry of Foreign Affairs and Trade gave the government in February 2002, prior to New Zealand ratifying Kyoto that year. It was in a document called National Interest Analyses - Kyoto Protocol Part II

"New Zealand has an initial assigned amount for the first commitment period currently estimated to be 365 million tonnes of carbon dioxide-equivalent. That is, New Zealand is allowed to emit 365 Mt of carbon dioxide (or equivalent in other gases) over the years 2008 to 2012...New Zealand is expected to emit between 50 and 75 million tonnes over its 365 Mt initial assigned amount during the commitment period...."
"Current estimates are that, during the commitment period: New Zealand will emit between 415 million and 440 million tonnes of carbon dioxide equivalent, and New Zealand sink activities (derived from forests planted from 1990 onwards) will provide an additional 110 million units of assigned amount, in the form of removal units."
"At a national level, New Zealand is therefore expected to have a surplus of assigned amount over emissions of between 35 and 60 million units over the five years of the first commitment period."

So the Ministry of Foreign Affairs and Trade were saying:

  1. New Zealand's greenhouse gas emissions would increase (not reduce) through to 2012.
  2. New Zealand would meet its Kyoto target by issuing itself additional forest sink removal units.
  3. New Zealand would make an economic gain from having a surplus of emission units.

So New Zealand would meet a 'trifecta' of Kyoto-related goals, none of which were reduced gross or net emissions.

The Ministry of Foreign Affairs and Trade were especially proud of that last point, making a profit.

"New Zealand’s effectiveness in climate change negotiations means it is one of the few developed countries that stands to make a small net economic gain from the first Kyoto Protocol commitment period."

So what would the Ministry of Foreign Affairs and Trade's predicted increased emissions and forest removal units look like on a chart? Assuming the maximum 75 million tonnes of carbon dioxide equivalent greenhouse gases is represented by a linear increase of 0.94% p.a. from a base of 73 million tonnes in 1990, and the forest removal units are issued equally over 2008 to 2012, it looks like this.

This is what 'gross-net Kyoto accounting' of emissions and emission units looks like. From 1990 to 2007, gross (or total emissions - blue dots) are the same as "Kyoto" emissions (the red dots). However, from 2008, you get the "Kyoto" emissions by subtracting carbon dioxide removed by 'human induced afforestation, reforestation and deforestation' (the violet dots) from the gross emissions. And the red dot Kyoto emissions suddenly dive under the 1990 baseline, even though both net and gross emissions have increased.

Except for the straight line, which is from my linear growth assumption, that looks very much like the current gross, net and Kyoto emissions, which I update below in a brand new animated 'Kyoto Escalator' chart

It's interesting to note that in the Ministry for the Environment's November 2012 calculation of the net Kyoto Protocol position, that although the ministry predicts a surplus of units (exceeding the target), this will happen in spite of an estimated 80% increase in annual net emissions since 1990 and a 27% increase in gross emissions. The actual gross and net emissions to 2010 have grown by 19% and 59% respectively, as shown in this chart

This is why whenever we hear Tim Groser or Nick Smith claim the New Zealand is meeting it's Kyoto target, we need to realise they are being the ultimate uncommitted unfaithful partner; in spite of their smooth rhetoric of caring about global warming, New Zealand's gross and net greenhouse emissions are showing an increasing trend. New Zealand needs to adopt policies that really do just stop emissions.

NB The original meme is Kyoto New Zealand break-up and all the images are at Picasa at Kyoto's Break-up with New Zealand where they can be viewed as a slide show. Feel free to use them and make up some more.