Showing posts with label open data. Show all posts

06 February 2023

Kyoto Protocol carbon prices 2005 to 2015 used by New Zealand's Ministry for the Environment

Perhaps the first data set of New Zealand carbon prices was the Ministry for the Environment's carbon prices used to calculate New Zealand's net position (either financial asset or liability) under the Kyoto Protocol.

The Ministry for the Environment had a web page About the 2008-2012 net position under the Kyoto Protocol

There was also a web page providing the Latest update on New Zealand's net position.

The net position was updated monthly in the crown financial statements for New Zealand issued by Treasury. A monthly data set of carbon prices was needed. From 2005, international carbon prices from either the United States ($USD) or Europe (euro) were converted to New Zealand dollars using the relevant foreign currency rate.

Another web page displayed the historic updates of the Kyoto Protocol financial information in the form of a table of eight columns. The seventh column was the carbon price in New Zealand dollars.

Here is what the table looked like.

Some years ago I saved an html file of that web page. I read the html file into R and tidied it into a data set with one row for every month and seven columns of variables. I even made a couple of charts!

In 2017, the Ministry for the Environment redesigned their website and the net position pages and the data set disappeared. I had thought about preserving it for the public record. I didn't get around to it.

I have just noticed I still have a folder of my R analysis. So I created a Github repository called Historic updates of the Kyoto Protocol carbon price. This now records the original .html file, some R script, the tidied data as a .csv file, a 'Readme' file and some charts.

I updated my chart!

I can't remember how I chose the colour of the line. It's "#D2691E" or "hot cinnamon".

What key point does the chart make?

The international market was flooded with "hot air" emission units from 2011. As the Morgan Foundation report Climate Cheats sets out.

One type of Kyoto carbon credit (the Emission Reduction Unit) was overcome by fraud and corruption in Ukraine and Russia. Virtually all of the credits issued by these countries are ‘hot air’ – they do not represent true emissions reductions. (Chapter 2)
Proportional to our emissions, New Zealand has been by far the largest purchaser of these Ukrainian and Russian credits through our Emissions Trading Scheme. This was due to deliberate decisions by the National-led Government to – unlike any other country – continue allowing unlimited use of these and other foreign credits for as long as the international community let us. (Chapter 3)
This fraud has had several nasty side-effects: It sent the price of carbon units in our Emissions Trading Scheme (ETS) to virtually zero, hammering our nascent carbon forestry industry.

09 September 2019

In 2018 the 6.7 million NZETS emission units allocated to 76 emitters were worth at least 243 million NZ dollars

All this data tidying and charting. It can lead to not seeing the forest for the trees. In this post I estimate the value of the 2018 free industrial allocation of emissions units to emitting industries. The number is 243 million New Zealand dollars. I find that gob-smacking

Following up from my last post, I wondered what was the market value of the 6.7 million emission units given to eligible emitters under the New Zealand Emissions Trading Scheme 2018 industrial allocation?

We will need market prices for emissions units. There is an online 'open data' Github repository of New Zealand Unit (NZU) prices going back to May 2010.

The NZU repository has it's own citation and DOI:

Theecanmole. (2016). New Zealand emission unit (NZU) monthly prices 2010 to 2016: V1.0.01 [Data set]. Zenodo. http://doi.org/10.5281/zenodo.221328

Under the Section 86 of the Climate Change Response Act 2002, eligible emitters or 'participants' in the ETS, as they are defined, may apply to the Environmental Protection Authority for a 'provisional' or estimated quantity of units for a future compliance year and for a 'final' or actual quantity of units for a past year.

We recall that one of National's 2009 amendments to the NZETS was to make unit allocation proportional to actual production. So that requires an provisional estimate and an actual 'wash-up' calculation once actual production from the regulated 'activity' is known.

The emitters must apply for both provisional and final allocations between 1 January and 30 April of each year. I am assuming that the EPA checks the applications and then transfers the initial allocation to accounts in the NZ Emissions Trading Register in May of each year.

The provisional allocation does not have to be gazetted or published. The final allocation must be gazetted or publicised on the EPA's website under Section 86B(5). But it can't be known until the EPA has received and processed all the historic wash-up applications for the just finished calendar year. That's why in September 2019 the EPA have only the 2018 unit allocations on their website. And not the 2018 final allocations.

It may be the accountant within me, but I think the emitters will want to get their initial application as close to 100% correct as possible. Or to exceed it. Because free units now will always be better than free units in 12 months time.

So let's assume the initial industrial allocation is transferred to emitters' accounts in May. At that point we can make a calculation of market value. We can check our NZU price data for a mid-May price as it's expressed in average monthly prices.

On our graph of of NZU prices, we add a vertical line for the 15th of May and then where that line intersects with the price line we add a horizontal line across to the prices on the Y axis. Or we could have looked up the .csv file of the prices. We get $NZ 21.38 per unit.

Multiplying the 6,743,573 units by $21.38 equals 143,503,233 NZ dollars!

I am gob-smacked by that! $143.5 million! Just gifted to emitters! Deliberately to reduce the effect of the carbon price on these privileged emitters. And as Idiot/Savant noted, the allocations will slowly and incrementally 'phase out' by the minutest of percentages until 2015!

Of the big three, New Zealand Steel received units worth $NZ 37.9 million, New Zealand Aluminium Smelters received units worth $NZ 28 million and Methanex received units worth $NZ 20 million. Here's the pie chart denominated in dollars.

Here is a bar chart which are usually easier to read.

Here is the tidied data of the name of the emitter, the amount of final units and the value at the mid May price of $NZ21.38. The data file is also at Google Drive sheets.

EPA Industrial Allocation Units Value 2018
Name Allocation Value
New Zealand Steel Development Limited 1782366 37928748.48
New Zealand Aluminium Smelters Limited 1324556 28186551.68
Methanex New Zealand Ltd 945210 20114068.8
Fletcher Concrete and Infrastructure Limited 584032 12428200.96
Oji Fibre Solutions (NZ) Limited 484322 10306372.16
Ballance Agri-Nutrients (Kapuni) Limited 325594 6928640.32
Pan Pac Forest Products Limited 210652 4482674.56
Norske Skog Tasman Ltd 200556 4267831.68
Winstone Pulp International Limited 151546 3224898.88
Graymont (NZ) Limited 144405 3072938.4
Whakatane Mill Limited 139690 2972603.2
ACI OPERATIONS NZ LIMITED 59945 1275629.6
Fonterra Limited 50664 1078129.92
Asaleo Care New Zealand Limited 29419 626036.32
Nelson Pine Industries Limited 26569 565388.32
Wallace Group Limited Partnership 26539 564749.92
Pacific Steel (NZ) Limited 19550 416024
EVONIK PEROXIDE LIMITED 18443 392467.04
Daiken New Zealand Limited 17770 378145.6
Dongwha New Zealand Limited 16854 358653.12
Status Produce Limited 15496 329754.88
Taranaki By-Products Ltd 14197 302112.16
Exception Limited 11618 247231.04
Tuakau Proteins Ltd 11393 242443.04
Anchor Ethanol Limited 10784 229483.52
Southern Paprika Limited 10406 221439.68
Alliance Group Limited 10012 213055.36
Affco New Zealand Limited 9465 201415.2
Under Glass (Karaka) Limited 7574 161174.72
Gourmet Mokai Limited 7006 149087.68
Under Glass (Bombay) Ltd 6194 131808.32
Websters Hydrated Lime Company Limited 5999 127658.72
J.S.Ewers Ltd 5853 124551.84
Hawkes Bay Protein Limited 5740 122147.2
CMP Canterbury Limited 5470 116401.6
Juken New Zealand Ltd 5304 112869.12
Gourmet Paprika Limited 4837 102931.36
PVL Proteins Limited 3632 77288.96
Fletcher Building Products Limited 3344 71160.32
Sharma Produce Limited 2677 56966.56
Gourmet Waiuku Limited 2190 46603.2
Kakariki Proteins Limited 2037 43347.36
Shipherd Nurseries Limited 1900 40432
Island Horticulture Limited 1717 36537.76
Tegel Foods Limited 1632 34728.96
Value Proteins Ltd 1581 33643.68
Whakatane Growers Limited 1393 29643.04
P H Kinzett Ltd 1344 28600.32
Moffatts Flower Company Limited 1182 25152.96
Karaka Park Produce Limited 1169 24876.32
Van Lier Nurseries Ltd 1123 23897.44
Taylor Preston Limited 1104 23493.12
Meenakshi Devi Sharma, Raj Kumar Sharma 1080 22982.4
Vege Fresh Growers Limited 1075 22876
Jai Shankar Growers Limited 928 19747.84
Prime Range Meats Limited 928 19747.84
Homestead Produce Ltd 881 18747.68
Sinai Hort Limited 604 12853.12
J.S. Mahey Limited 599 12746.72
Castle Rock Orchard Ltd 564 12001.92
Karamea Tomatoes Limited 526 11193.28
Poppas Peppers 2009 Limited 351 7469.28
Taaza Green Limited 337 7171.36
Harbour Head Growers Ltd 261 5554.08
Ting-Yuan Robert Wu 239 5085.92
Parkgard Growers 2000 Limited 222 4724.16
Antone James Ivicevich, Joanne Elizabeth Gould Ivicevich 210 4468.8
Graeme Lowe Protein Limited 198 4213.44
Mary Jane Fausett, Peter James Fausett 143 3043.04
Pomoana Gardens Limited 100 2128
John Hamilton Charles Falloon, Paul Gregory Whitehead 79 1681.12
Royal Roses Limited 66 1404.48
Kingbridge Ltd 61 1298.08
Eseta Kovati, Reupena Kovati 37 787.36
GELITA NZ Ltd 29 617.12
Wallace Corporation Limited 0 0

02 September 2019

Ten NZ companies were given 6.7 million free emission units in 2018

Have open tidy data; will graph it. I whip up a pie chart of the top ten New Zealand companies rorting the New Zealand Emissions Trading Scheme via free allocation of emissions units.

Of 6.7 million NZ Emissions Trading Scheme emission units allocated by the Environmental Protection Authority (given for free instead of being sold by auction) to industries in 2018, 6.2 million or 91% went to ten well-known New Zealand companies.

Here is the R script.

Here is the data of the emissions units gifted for free to industrial emitters in 2018.

Windfall gifting of emissions units to industry in 2018
Name Allocation
New Zealand Steel Development Limited 1,782,366
New Zealand Aluminium Smelters Limited 1,324,556
Methanex New Zealand Ltd 945,210
Fletcher Concrete and Infrastructure Limited 584,032
Oji Fibre Solutions (NZ) Limited 484,322
Ballance Agri-Nutrients (Kapuni) Limited 325,594
Pan Pac Forest Products Limited 210,652
Norske Skog Tasman Ltd 200,556
Winstone Pulp International Limited 151,546
Graymont (NZ) Limited 144,405
Whakatane Mill Limited 139,690
ACI OPERATIONS NZ LIMITED 59,945
Fonterra Limited 50,664
Asaleo Care New Zealand Limited 29,419
Nelson Pine Industries Limited 26,569
Wallace Group Limited Partnership 26,539
Pacific Steel (NZ) Limited 19,550
EVONIK PEROXIDE LIMITED 18,443
Daiken New Zealand Limited 17,770
Dongwha New Zealand Limited 16,854
Status Produce Limited 15,496
Taranaki By-Products Ltd 14,197
Exception Limited 11,618
Tuakau Proteins Ltd 11,393
Anchor Ethanol Limited 10,784
Southern Paprika Limited 10,406
Alliance Group Limited 10,012
Affco New Zealand Limited 9,465
Under Glass (Karaka) Limited 7,574
Gourmet Mokai Limited 7,006
Under Glass (Bombay) Ltd 6,194
Websters Hydrated Lime Company Limited 5,999
J.S.Ewers Ltd 5,853
Hawkes Bay Protein Limited 5,740
CMP Canterbury Limited 5,470
Juken New Zealand Ltd 5,304
Gourmet Paprika Limited 4,837
PVL Proteins Limited 3,632
Fletcher Building Products Limited 3,344
Sharma Produce Limited 2,677
Gourmet Waiuku Limited 2,190
Kakariki Proteins Limited 2,037
Shipherd Nurseries Limited 1,900
Island Horticulture Limited 1,717
Tegel Foods Limited 1,632
Value Proteins Ltd 1,581
Whakatane Growers Limited 1,393
P H Kinzett Ltd 1,344
Moffatts Flower Company Limited 1,182
Karaka Park Produce Limited 1,169
Van Lier Nurseries Ltd 1,123
Taylor Preston Limited 1,104
Meenakshi Devi Sharma, Raj Kumar Sharma 1,080
Vege Fresh Growers Limited 1,075
Jai Shankar Growers Limited 928
Prime Range Meats Limited 928
Homestead Produce Ltd 881
Sinai Hort Limited 604
J.S. Mahey Limited 599
Castle Rock Orchard Ltd 564
Karamea Tomatoes Limited 526
Poppas Peppers 2009 Limited 351
Taaza Green Limited 337
Harbour Head Growers Ltd 261
Ting-Yuan Robert Wu 239
Parkgard Growers 2000 Limited 222
Antone James Ivicevich, Joanne Elizabeth Gould Ivicevich 210
Graeme Lowe Protein Limited 198
Mary Jane Fausett, Peter James Fausett 143
Pomoana Gardens Limited 100
John Hamilton Charles Falloon, Paul Gregory Whitehead 79
Royal Roses Limited 66
Kingbridge Ltd 61
Eseta Kovati, Reupena Kovati 37
GELITA NZ Ltd 29
Wallace Corporation Limited 0

31 August 2019

If we can't tidy up the NZ emissions trading scheme can we tidy up the dataframe of the free allocation of units

I do some data cleaning and tidy up the EPA's table of 2018 free giveaway emissions units.

In this follow up post about the EPA's non-tidy table of 2018 industrial allocation/free giveaway of emissions units, I use a great opensource programme OpenRefine to tidy the allocation data into a 'tidy' format of 'each variable is a column, each row is a an observation and each cell is a value'.

I have recorded my commands as much for my own benefit in the future if and when I try to replicate the commands. There's a joke in the reproducible research online community "the hardest person to email questions to is yourself three years ago".

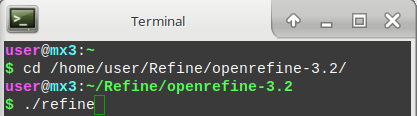
Assuming you have installed OpenRefine to your Linux Debian based operating system, open a terminal window and type:

cd /home/user/Refine/openrefine-3.2/

Type './refine' and press enter

Wait for Firefox to start at IP http://127.0.0.1:3333/ which will start OpenRefine

Go to the Google sheet obtained from the EPA webpage https://docs.google.com/spreadsheets/d/1arfDpqiXg84SwTAiY5TWzDxOJNrnJxvG9GgyBY8jCRM/ and download the .csv file to '/home/user/Downloads'

Copy the downloaded .csv file to /home/user/Refine/openrefine-2.6-beta.1/

Go back to Firefox and enter "http://127.0.0.1:3333/" into the address bar. That will open OpenRefine.

In OpenRefine, select the button "Create a project by importing data"

Browse to and select /Refine/openrefine-2.6-beta.1/NZ-emission-unit-industrial-allocation-decisions-EPA-2018 - Sheet1.csv

Click on 'Next' button and 'create new project'

Select and tick 'ignore first line at the beginning of the file

Tick 'Parse next 1 line as column headers'

Click on 'create new project'

We should have 108 rows of data - look at the second column, it mixes two variables, 'Applicants name' and 'Activity'

Edit column - Add new column 'Activity' based on column *Activity and Applicant's Name* - add name 'Activity'

write " if(value.startsWith("*"), value[1,37],"")" into the Expression box. That moves only the activities into their own column.

Edit column, Add column based on column Applicants Name called 'Name'

in the Expression box , leave 'value' in box and copy the column by selecting 'ok'

Select Activity column, edit cells, fill down (fills all Activities to empty cells)

Edit column - Add new column 'Year' based on column *Activity and Applicant's Name* - add name 'Year' and value '2018' in expression box

Select the header *2018 Final Unit Entitlement*, edit cells, common transforms, to number

Select the header *2018 Final Unit Entitlement*, select Facet, numeric facet, go to left side of dashboard, untick 'numeric' box, leave 'blank' box (24 records) ticked,

Select column 'All', then Edit rows, remove all matching rows (that leaves 84 rows with no blank cells in *2018 Final Unit Entitlement*)

Select column *Activity and Applicant's Name*, Edit column, Remove this column

Select column *Activity", Edit column - Add new column 'Activity' based on column 'Activity2' - add name 'Activity' and expression in box enter value.replace("*","") - to remove the *. And we have a tidy data table!

Click on the data project name at the top and just right of the "OpenRefine" label "NZ-emission-unit-industrial-allocation-decisions-EPA-2010-2018-Sheet1-csv". Change the name to "NZ emission unit industrial allocation decisions EPA 2018 tidy"

Select 'Export' (in top right corner) as a .csv file

Upload the csv file to Google Drive via the Gdrive command line utility

Open a xterminal window, for first upload enter;

gdrive upload /home/user/Refine/NZ-emission-unit-industrial-allocation-decisions-EPA-2018-tidy.csv

In Google sheets i changed the file's name to "NZ-emission-unit-industrial-allocation-decisions-EPA-2018-tidy" and I 'shared' the file to 'public'.

Download the file to your computer and open it with a spreadsheet program such as gnumeric.

We can see that we now have a tidy dataframe where each variable is a column, each row is a an observation and each cell is a value - the number of emissions units given away for free to greenhouse gas emitters under the NZ emissions trading scheme.

25 August 2019

Industrial allocation of ETS emissions units to emitters is subsidizing polution forever

On 31 July, the indefatigable Idiot/Savant of No Right Turn blog reported that the Government had decided to start a very gradual phase-out of 'free allocation' of emissions units to industrial emitters.

The media statement released by James Shaw states:

"The plan is to begin phasing down industrial allocation at 1 per cent per year from 2021-2030, then at 2 per cent from 2030-2041, and at 3 per cent per year from 2041-2050".

To quote Idiot/Savant:

"And when you do the maths, it means the government will still be subsidising highly intensive industrial polluters by 20% of their emissions in 2050, the year we're supposed to be at net-zero emissions.
This is bullshit, simply bullshit. And it is bullshit neither the country nor the planet can afford".

Idiot/Savant termed this "Pollution forever". I agree with him. This is just an appalling policy. Every emission unit given for free to an emitter is a right to emit one tonne of greenhouse gases. Its a voucher for pollution. It's worse than that, it's an instruction to pollute. Every unit allocated represents a blunting of the price incentive to reduce emissions. It's exactly the same as the Government giving the emitters petrol (or coal) vouchers paid for by the taxpayer. I am amazed that James Shaw can even put his name to this policy.

Idiot/Savant is the only blogger, or commentator for that matter, in New Zealand, who is regularly providing hard analysis of climate change and emissions trading scheme policy. In a further post, he looks at how the free industrial allocation of units will benefit New Zealand's largest industrial emitters; NZ Steel, New Zealand Aluminum Smelters Ltd, Ballance Agri-Nutrients (Urea) and Methanex (methanol).

In this post, I am going to go through the steps to obtain the latest data, for the 2018 calendar year, of free allocation of emissions units from the webpage of the NZ Environmental Protection Authority. And then upload it to Google sheets.

Here is the EPA webpage listing the final annual allocations from 2010 to 2018.

Okay, we need to scroll down and expand the tabs to see the data.

We see that the industrial activity of aluminium smelting always leads off. New Zealand Aluminium Smelters Limited received 1.3 million units for 2018. Alphabetical order is after all the text version of linear progression.

The EPA web site has a copyright statement saying that a Creative Commons International Attribution licence applies to their website.

And Section 86B "Decisions on applications for allocations of New Zealand units to industry and agriculture" of the Climate Change Response Act requires the EPA to publish the final allocation numbers in the Gazette and on the EPA website.

So the industrial free allocation data is intended to be available to and used by the public. However, the EPA does not provide a link for downloading the data in an 'open data' format such as text, .csv or spreadsheet. There is a table. However it is not in a 'tidy' format. The variable denoting the industrial activity for which the emitter is eligible for allocation has a row to itself. In a tidy format, each variable would be a column and each observation a row.

To obtain the data, I am going to repeat a 'webscrape' I have used before. I create a new google sheet. I insert the url of the EPA Industrial allocation decision webpage into cell 'A1'. I insert the text '=importhtml(A1,"table",1)' into cell A2. And the full table of the 2018 year unit allocation data appears in the sheet.

The next step will be cleaning the data to make it 'tidy' Then some data analysis. That can be a new post.

22 July 2017

The slow road to getting open data from the Government's Clean Water 2017 water quality monitoring sites

Who remembers the National Government's consultation over it's proposed Clean Water package 2017?

Who remembers the headline announcement of the proposal? - that there would be a 'target', that 90% of rivers and lakes would be swimmable by 2040?

The environmental NGOs were very critical of the target (and the proposal as a whole).

The Green Party said the new swimmable standard was just shifting the goalposts.

Forest & Bird's Kevin Hague described the proposal as a reduced swimmability standard.

Marnie Prickett of the Choose Clean Water group described the proposal as "fraud" as it intended to change the definition of swimmable to meet a lower standard.

The environmental NGO's argument was that the new proposed 'risk' standard for swimming (expressed in E Coli as an indicator of faecal matter and pathogens) allowed a one in a twenty probability of getting sick when the old standard was a much more precautionary one in a hundred probability of getting sick.

Dr Siouxsie Wiles and Dr Jonathan Marshall explained that the change in risk wasn't quite as simple as that. As did University of Auckland Professor of Biostatistics Thomas Lumley.

However, I thought there was something wrong with that 90 percent number. I seemed to recall Green MP Eugenie Sage saying in 2014 that more than 60 percent of the monitored river swimming sites were unfit for swimming.

The Clean Water package 2017 included this barchart which shows that the 90% 'swimmable' target (and five new swimming quality categories from 'excellent' to 'poor') are actually expressed in a different variable: length of river measured in kilometres (not in number of monitoring sites).

It also shows, in the left-most bar, that the use of the use of the 'length of river' variable in place of numbers of river monitoring sites, results in a very different result.

On the basis of recent data, 72 percent of kilometres of rivers currently meet the 'swimmable' standard (the sum of the 'Fair', 'Good' and 'Excellent' quality categories. Expressing the results in kilometres of river lengths and not in numbers of sampling sites immediately enables a more positive spin to be put on the results.

The underlying data must be water quality sampling results from NIWA's National Rivers Water Quality Network (NRWQN) and sites operated by regional councils.

So, way back on 15 March 2017, I asked for the underlying sampling data from the water quality monitoring sites.

I felt I had expressed my official information request sufficiently clearly to get a reply in a reasonable time.

On your website on the page "Clean Water package 2017" there is a bar chart explaining the target of 90% of rivers and lakes swimmable by 2040 included in the report "Clean Water, ME 1293". The bar chart is also on page 11 of report "Clean Water, ME 1293". The bar chart shows kilometres (which I assume are lengths of segments of rivers) in each of the five 'quality' categories (Poor, Intermittent, etc) with a time variable which has three bars; "Current", "2030" and "2040".

Will you please provide me with the underlying data; which I assume must be water quality monitoring site results (and future predictions for 2030 and 2040) analysed by the five quality categories and the three time categories "Current", "2030" and "2040". Will you also please include the name or number of each monitoring site, its region and for the "Current" selection, the sampling period for the actual E Coli counts. Please provide this data either in comma separated values or Excel 2007 format via the FYI website.

However, I had to lodge a complaint with the Office of the Ombudsmen to eventually obtain the data. That only happened after the investigator from the Office of the Ombudsmen brokered a deal with the Ministry for the Environment. He rang me and said that the Ministry didn't want to give me the data in either .csv or .xls format as I'd requested as the data was in a special binary format; .rdata, specific to a certain statistical programming language named after the letter 'R'.

In other words, it appeared to me the Ministry were claiming that a 'technical' problem in providing me the data I had requested, and not a problem of intent to frustrate the information request.

Sure, it's fair enough to take the Ministry at their word that they didn't intend to delay and frustrate my request. However, whatever the intention, it was still a delay from my point of view as the requester.

I told the investigator I would be happy to get the data in .rdata format. I also expressed the view that it would have only been a very short line of 'R' script to convert the .rdata formatted file into .csv format. And that it was a weak reason for the delay and for not providing me the data in .csv format. I observed that the Ministry's response was pretty unsatisfactory from an open data perspective. The investigator said he couldn't comment on open data issues, as we were in an official information space.

I was finally emailed the data in .rdata format by the Manager, Executive Relations, on 5 July 2017.

I used this R script;

to write the .rdata file to a .csv file.

The .rdata file is WQdailymeansEcoli.rdata at Google Drive.

The .csv format file is WQdailymeansEcoli.csv at Google Drive.

Now I just need to find the time to analyse the sampling sites data.

25 February 2017

Graph of atmospheric carbon dioxide concentrations from another cool data package

I feature another cool self-updating data package, this time of concentrations of atmospheric carbon dioxide recorded from the well-known Mauna Loa Observatory, in Hawaii. Graphs of this data are perhaps the most iconic images of anthropogenic climate change.

This post features the atmospheric carbon dioxide data package. Again, it is one of the Open Knowledge International (OKFN) Frictionless Data core data packages, that is to say it is one of the

"Important, commonly-used datasets in high quality, easy-to-use & open form".

The data is known as the Keeling Curve after the American chemist and oceanographer Charles Keeling. It is an iconic image for anthropogenic climate change.

Like the global temperature data package, the atmospheric carbon dioxide data package is open and tidy and self-updating and resides in an underlying Github data package .

Similarly, the data package can be downloaded as a zip file and unzipped into a folder. That will include the data files in .csv format, an open data licence, a read-me file, a json file and a Bash script that updates the data from source.

I can run the Bash script file on my laptop in an X-terminal window and it goes off and gets the latest data and formats it into 'tidy' csv format files.

Here is a screenshot of the script file updating and formatting the data.

Here is my chart.

Here is the R code for the chart.

13 January 2017

2016 the warmest year on record via a cool self-updating data package of global temperature

Radio New Zealand reports that 2016 was the new record warmest year in the instrumental record, so I will pitch in too. But with an extra touch of open data and reproducible research.

It's been a while since I uploaded a chart of global temperature data. Not since I made this graph in 2011 and then before that was this graph from 2010. So it's about time for some graphs. Especially since 2016 was the world's warmest year as well as New Zealand's warmest year.

When I made those charts, I had to do some 'data cleaning' to convert the raw data to tidy data (Wickham, H. 2014 Sept 12. Tidy Data. Journal of Statistical Software. [Online] 59:10), where each variable is a column, each observation is a row, and each type of observational unit is a table. And to convert that table from text format to comma separated values format.

I would have used a spreadsheet program to manually edit and 'tidy' the data files so I could easily use them with the R language. As Roger Peng says, if there is one rule of reproducible research it is "Don't do things by hand! Editing data manually with a spreadsheet is not reproducible".

There is no 'audit trail' left of how I manipulated the data and created the chart. So after a few years even I can't remember the steps I made back then to clean the data! That then can be a disincentive to update and improve the charts.

However, I have found a couple of cool open and 'tidy' data packages of global temperatures that solve the reproducibility problem. The non-profit Open Knowledge International provides these packages as as part of their core data sets.

One package is the Global Temperature Time Series. From it's web page you can download two temperature data series at monthly or annual intervals in 'tidy' csv format. It's almost up to date with October 2016 the most recent data point. So that's a pretty good head start for my R charts.

But it is better than that. The data is held in a Github repository. From there the data package can be downloaded as a zip file. After unzipping, this includes the csv data files, an open data licence, a read-me file, a .json file and a cool Python script that updates the data from source! I can run the script file on my laptop and it goes off by itself and gets the latest data to November 2016 and formats it into 'tidy' csv format files. This just seems like magic at first! Very cool! No manual data cleaning! Very reproducible!

Here is a screen shot of the Python script running in a an X-terminal window on my Debian Jessie MX-16 operating system on my Dell Inspiron 6000 laptop.

The file "monthly.csv" includes two data series; the NOAA National Climatic Data Center (NCDC), global component of Climate at a Glance (GCAG) and the perhaps more well-known NASA Goddard Institute for Space Studies (GISS) Surface Temperature Analysis, Global Land-Ocean Temperature Index.

I just want to use the NASA GISTEMP data, so there is some R code to separate it out into its own dataframe. The annual data stops at 2015, so I am going to make a new annual data vector with 2016 as the mean of the eleven months to November 2016. And 2016 is surprise surprise the warmest year.

Here is a simple line chart of the annual means.

Here is a another line chart of the annual means with an additional data series, an eleven-year lowess-smoothed data series.

Here is the R code for the two graphs.

28 September 2016

Opening up the Ministry for the Environment data and webscrape the 2015 free allocation of emission units

Let's look at the latest data on the very generous free give-aways of emissions units to emitters made by the New Zealand Ministry for the Environment
N.B. Update on 10 December 2016. The allocation decisions have moved to the web page of the Environmental Protection Authority
.

The Environmental Protection Authority now hosts the 2015 Industrial Allocation Decisions that show the final free allocation of emission units to emitters for 2015 under the New Zealand Emissions Trading Scheme.

The New Zealand Ministry for the Environment no longer hosts the unit allocation data and the old link returns an Acess Denied page.

I looked at the 2010 to 2014 data in my post Opening up the data on emissions units in the NZ emissions trading scheme. So in this post I am will repeat my steps in web-scraping the freebie emissions unit data into a sensible open-data format (but with the links updated to the EPA).

The url of the old Ministry for the Environment web page is http://www.mfe.govt.nz/climate-change/reducing-greenhouse-gas-emissions/new-zealand-emissions-trading-scheme/participatin-4

The url of the EPA web page is http://www.epa.govt.nz/e-m-t/taking-part/Industrial-allocations/allocations-decisions/Pages/decisions-2010.aspx. And unfortunately, the Google sheet 'scrape the table' script does not seem to work with the EPA page.

Go to Google and open a new Google sheet.

Following the tip from the School of Data Liberating HTML Data Tables, enter this text in cell A1 of the Google sheet.

=importHTML("","table",1)

Add the url of the Ministry for the Environment's free allocation web-page between the double speech marks so you have this exact text in cell A1.

=importHTML("http://www.mfe.govt.nz/climate-change/reducing-greenhouse-gas-emissions/new-zealand-emissions-trading-scheme/participatin-4","table",1)

It was good thing that I kept a screen shot to show that it worked perfectly! We now have a Google sheet of the 2015 free unit allocation to NZ emissions trading scheme emitters.

I have saved it as NZETS-2015-final-allocations-for-eligible-activities.

However, the data does not have a "tidy" structure, where each variable is a column and each observation is a row (Wickham, Hadley . "Tidy Data" Journal of Statistical Software [Online], Volume 59, Issue 10 (12 September 2014)).

The first column includes both industry names and types of industries classified by the type of emissions the industry produces. And lots of asterisks. A tidy format would have these attributes (or variables) as separate columns so that each company/emitter would have a row each.

I used a programme called Open Refine (which is also at Github) to data-wrangle the data into tidy format and to save it as a comma-separated values file which is this Google sheet NZETS-2015-final-allocations-for-eligible-activities. Its a bit fiddly using Open Refine, and I have not documented the steps. I won't describe how I did it. Yes, I know, from the point of view of reproducing the tidied data I should have done the tidying with a script or code. Next time I will.

As usual, the big emitters get the most emission units! Of 4.417 million units allocated to industries, 90% went to 11 large companies. New Zealand Steel Development Limited, of arbitrage profits fame, gets 1,067,501 free units. New Zealand Aluminium Smelters Limited gets 772,706 free units.

This is the updated free emission unit allocation data from 2010 to 2015.

I did a bit of data visualising with the 2015 data and created this pie-chart in R programming language.

The R script for that is:

Did I not get the End the Rainbow memo? So I picked a better colour scale from Colour Brewer.

The R script for this non-rainbow pie chart is:

18 June 2016

Emissions Trading Scheme unit allocations are open data but units surrendered and actual emissions are state secrets

It would be good if we could compare actual company emissions under the NZ emissions trading scheme ("ETS") to the generous free allocations of units some entities receive. But we can't. It's half secret. So how will we ever know if allocations are excessive?

Someone recently asked me if there was enough publicly available information to be able to tell how the free allocation of NZ emission units to some privileged ETS participants under the NZ Emissions Trading Scheme related to the emitters actual emissions of greenhouse gases.

This information would be the number of emission units allocated to some emitters on the one hand, and on the other hand, the actual emissions of the emitters as reported to the Environmental Protection Authority and the actual numbers of corresponding emission units they surrender to the Environmental Protection Authority.

I replied "No, the data is not available". A response which, although it contains a grain of truth, still doesn't reflect the whole story. So this post is an attempt at that story.

In the past few years, I have written several posts about the significance of the free allocation of emission units to New Zealand Aluminium Smelters Limited, Norske Skog Tasman and New Zealand Steel.

In each case I concluded that the free allocations of units (including units for energy costs) were excessive. That these were cases of 'over-allocation'.

In those posts I had to make estimates of the actual emissions and actual units surrendered. Although the New Zealand Environmental Protection Authority completely discloses the annual free allocation of units, neither the Ministry for the Environment or the Environmental Protection Authority report the actual emissions and units surrendered by entity.

As I noted recently I have compiled a Google sheet of all units allocated to emitters from 2010 to 2014.

So good on the Environmental Protection Authority and the Ministry for the Environment. A while ago I made this pie chart of the 2011 allocations from the Ministry. Yes, awful rainbow colours, I know! But it still makes it clear that the vast bulk of free units get allocated to the top ten or so emitters - who happen to also be some of New Zealand's largest and most influential companies.

I was running out of emitters like NZ Steel and NZ Aluminium Smelters Ltd who both have unique operations. Both are the only example of their industry in New Zealand.

So I could look at 'category' emissions for 'aluminium smelting' and 'steel making from iron sands' in the Ministry for the Environment's greenhouse gas inventory reports and be confident the category emissions were the same as the company emissions.

So, back on 28 March 2013, I made a request under the Official Information Act (OIA) to the Environmental Protection Authority, who administer the reporting of emissions and surrendering of units in the ETS.

I asked for number of units surrendered by the top eleven ETS participants (New Zealand Steel Limited, New Zealand Aluminium Smelters Limited, Methanex New Zealand Limited, Fletcher Concrete and Infrastructure Limited, Ballance Agri-Nutrients Limited, Holcim (New Zealand) Limited, Carter Holt Harvey Pulp & Paper Limited, Pan Pac Forest Products Limited, McDonalds Lime Limited, Winstone Pulp International Limited, Whakatane Mill Limited) for 2010 and 2011.

On 18 April 2013, the Environmental Protection Authority declined my request.

On 19 April 2013 I made a complaint about the EPA decision to the Office of the Ombudsman.

Almost a year later, on 8 April 2014, the Ombudsman concluded his investigation and said that the EPA were correct in refusing to give me the information as the Climate Change Response Act 2002 explicitly applies to the surrender of units in priority to the Official Information Act 1982.

The Deputy Ombudsman Leo Donnelly advised that he agreed with the EPA view that they did not have to provide the information on units surrendered. This is the key passage from his letter dated 8 April 2014.

"I am not persuaded that the Official Information Act is an Act that provides for the disclosure of information in s 99(2)(a) of the Climate Change Response Act.
The Official Information Act confers a right to request official information and requires that such requests be processed in accordance with its provisions, but those provisions do not provide for the disclosure of information under the Climate Change Response Act (or any other Act that imposes restrictions on the availability of official information).
Instead, section 52(3)(b)(i) of the Official Information Act provides that nothing in that Act derogates from any provision which is contained in any other Act which imposes a prohibition or restriction in relation to the availability of official information. Section 99 is such a section.
Accordingly, the Official Information Act does not override the restrictions imposed by section 99 of the Climate Change Response Act and it would be contrary to that section for the requested information to be made available to you. Consequently, section 18(c)(1) of the Official Information Act provides a reason to refuse your request on that basis."

I was bloody disappointed with that response. Here is the Ombudsman's letter. I also didn't know that the Official Information Act only applies if another statute allows it too. I will look at the relevant sections in detail.

Section 52(3)(b)(i) of the Official Information Act states;

(3) Except as provided in sections 50 and 51, nothing in this Act derogates from—
(a) ....
(b) any provision which is contained in any other Act of Parliament or in any regulations within the meaning of the Regulations (Disallowance) Act 1989 (made by Order in Council and in force immediately before 1 July 1983) and which
(i) imposes a prohibition or restriction in relation to the availability of official information;...

So if another statute (or regulation) prohibits or restricts the availability of official information, then that statute or regulation applies irrespective of the Official Information Act.

Section 99 of the Climate Change Response Act certainly appears to prohibit the availability of information. It states;

This section applies—
(a) to the chief executive, the EPA, an enforcement officer, and any other person who performs functions or exercises powers of the chief executive, the EPA, or an enforcement officer under this Part and Part 5; and
(b) at the time during which, and any time after which, those functions are performed or those powers are exercised.
(2) A person to whom this section applies—
(a) must keep confidential all information that comes into the person’s knowledge when performing any function or exercising any power under this Part and Part 5; and
(b) may not disclose any information specified in paragraph (a), except—
(i) with the consent of the person to whom the information relates or of the person to whom the information is confidential; or
(ii) to the extent that the information is already in the public domain; or
(iii) for the purposes of, or in connection with, the exercise of powers conferred by this Part or for the administration of this Act; or
(iiia) for the purposes of, or in connection with, reporting requirements of the Public Finance Act 1989; or (iv) as provided under this Act or any other Act; or
(v) in connection with any investigation or inquiry (whether or not preliminary to any proceedings) in respect of, or any proceedings for, an offence against this Act or any other Act; or
(vi) for the purpose of complying with any obligation under the Convention or the Protocol.
(3) A person to whom this section applies commits an offence under section 130 if the person knowingly contravenes this section.....

So why does the Ministry for the Environment publish the annual allocations of units on its website? Why is the policy for unit allocation effectively open data (with complete public disclosure) when the policy for emissions and units surrendered in the ETS, the policy is 'Official Secrets Act?

The answer is the perfect bureaucrat's answer, because the Act says so.

Section 86B Decisions on applications for allocations of New Zealand units to industry and agriculture of the Climate Change Response Act states:

(5) The EPA must, as soon as practicable, after deciding an eligible person’s final allocation for an eligible activity in respect of a year,—
(a) publish the decision in the Gazette; and
(b) ensure it is accessible via the Internet site of the EPA
.

Where does this leave us? It's the old story of the three-handed forestry consultant. 'On the one hand, on the second hand, but on the third hand..' Its great that the data on free allocation of units to emitters is fully disclosed. I am sure many of them wouldn't want that. However, without data on units surrendered and actual annual emissions under the ETS, no one can make much of an assessment of whether the units allocated are reasonable or over-allocated in terms of exceeding actual emissions. Transparency (and legitimacy) would be very much improved if the actual emissions and unit surrenders were just as open as the unit allocations