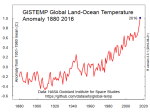
 Radio New Zealand reports that 2016 was the new record warmest year in the instrumental record, so I will pitch in too. But with an extra touch of open data and reproducible research.
It's been a while since I uploaded a chart of global temperature data. Not since I made this graph in 2011 and then before that was this graph from 2010. So it's about time for some graphs. Especially since 2016 was the world's warmest year as well as New Zealand's warmest year.
When I made those charts, I had to do some 'data cleaning' to convert the raw data to tidy data (Wickham, H. 2014 Sept 12. Tidy Data. Journal of Statistical Software. [Online] 59:10), where each variable is a column, each observation is a row, and each type of observational unit is a table. And to convert that table from text format to comma separated values format.
I would have used a spreadsheet program to manually edit and 'tidy' the data files so I could easily use them with the R language. As Roger Peng says, if there is one rule of reproducible research it is "Don't do things by hand! Editing data manually with a spreadsheet is not reproducible".
There is no 'audit trail' left of how I manipulated the data and created the chart. So after a few years even I can't remember the steps I made back then to clean the data! That then can be a disincentive to update and improve the charts.
However, I have found a couple of cool open and 'tidy' data packages of global temperatures that solve the reproducibility problem. The non-profit Open Knowledge International provides these packages as as part of their core data sets.
One package is the Global Temperature Time Series. From it's web page you can download two temperature data series at monthly or annual intervals in 'tidy' csv format. It's almost up to date with October 2016 the most recent data point. So that's a pretty good head start for my R charts.
But it is better than that. The data is held in a Github repository. From there the data package can be downloaded as a zip file. After unzipping, this includes the csv data files, an open data licence, a read-me file, a .json file and a cool Python script that updates the data from source! I can run the script file on my laptop and it goes off by itself and gets the latest data to November 2016 and formats it into 'tidy' csv format files. This just seems like magic at first! Very cool! No manual data cleaning! Very reproducible!
Here is a screen shot of the Python script running in a an X-terminal window on my Debian Jessie MX-16 operating system on my Dell Inspiron 6000 laptop.
The file "monthly.csv" includes two data series; the NOAA National Climatic Data Center (NCDC), global component of Climate at a Glance (GCAG) and the perhaps more well-known NASA Goddard Institute for Space Studies (GISS) Surface Temperature Analysis, Global Land-Ocean Temperature Index.
I just want to use the NASA GISTEMP data, so there is some R code to separate it out into its own dataframe. The annual data stops at 2015, so I am going to make a new annual data vector with 2016 as the mean of the eleven months to November 2016. And 2016 is surprise surprise the warmest year.
Here is a simple line chart of the annual means.
Here is a another line chart of the annual means with an additional data series, an eleven-year lowess-smoothed data series.
Here is the R code for the two graphs.


No comments:
Post a Comment