Here is a new Kevin Anderson video. Anderson spoke at an event hosted by the Danish Institute for International Studies on Thursday 26 April 2018.
25 March 2018
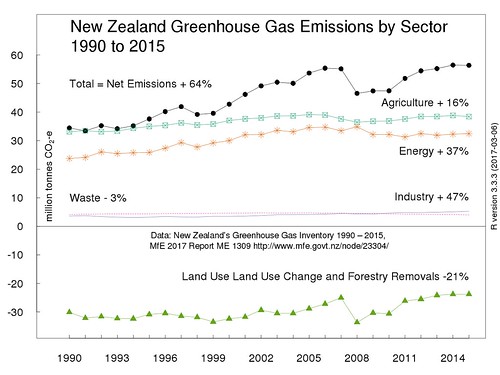
Charting New Zealand Greenhouse Gas Emissions by Sector 1990 to 2015
I have created a revised chart of New Zealand's greenhouse gas emissions analysed by economic sector for the years from 1990 to 2015. Something I have done before. Before that I made a chart of just the gross and net emissions.
This first image is an uploaded .png file at actual size (560 pixels wide) which is the width of the text container in the blog's template.

For a comparison, this second image uses Flickr's embed code to show a larger file (1280 pixels wide) I uploaded to Flickr. It's not a very large file; 128 kilobytes. That seems minute, when I am uploading 4MB or larger photographs to Flickr. If I wanted a larger file, I could output the chart from R as a .tiff format file.
The first smaller image uploaded to Blogger seems slightly clearer.
The data source is of course;
"New Zealand's Greenhouse Gas Inventory 1990–2015", Publication date: May 2017, Publication reference number: ME 1309, Full report - New Zealand’s Greenhouse Gas Inventory 1990-2015, and supporting tables and files. CRF summary data [Excel file, 45.6 KB]
The key difference from previous charts is that I have omitted gross emissions or as the Ministry for the Environment calls them "Gross emissions without Land Use, Land Use Change and Forestry (LULUCF)". Gross emissions frequently if not mostly seem to be the focus of analysis of trends and achievement of targets. Land Use, Land Use Change and Forestry emissions frequently get omitted.
I started with the sector emissions, then I added net emissions. Net emissions are the sum of the sectoral emissions obviously. Net emissions (with a qualification I may address in another post) are what end up in the atmosphere. So from a science-informed viewpoint, analysis of trends should be based on net emissions.
What struck me is that this format highlights a different interpretation of trends. Look how much of NZ's 1990 emissions were 'counter-balanced' by Land Use, Land Use Change and Forestry. In 1990, the land use and forestry sector sequestration (removal) of greenhouse gases was equivalent to the sum of the other sectors excluding agriculture. The 1990 net emissions were the same as the emissions from the agriculture sector. In other words, if you excluded agriculture emissions, NZ's emissions in 1990 would have been 'net zero'.
Since 1990, the land use and forestry sector sequestration has declined by 21%. In 1991, the land use and forestry sector sequestration 'counterbalanced' 100% of non-agriculture emissions. In 2015, the land use and forestry sector sequestration only counterbalanced only 57% of non-agriculture emissions. As long as land use and forestry sequestration is measured consistently over time, this trend can only get worse. A lot of commercial forest planting happened in the 1990s. These forests will soon be due for harvesting. That's why I want to scream each time I hear some pundit say forestry will be a 'get out of jail card' for growing emissions in other sectors, notably agriculture.
Here is the R script (with a couple of Linux Xterminal commands) for obtaining and preparing the data and for creating the chart.
22 March 2018
Kevin Anderson Are universities making the world worse? Education and research in an age of climate change
Centre for Environment and Development Studies in Uppsala, CEMUS, From Almedalen. Published on 10 August 2017.
Kevin Anderson, Zennström Visiting Professor in Climate Change Leadership, Uppsala University.
Josefin Wangel Weithz, Associate Professor in Sustainable Urban Development, KTH.
Johanna van Schaik Dernfalk, Unit manager, Environmental and Agricultural Sciences, Formas.
What is the role of universities in response to the great environmental and social challenges of our times? In an age of escalating climate change, ecological unravelling and societal instability and uncertainty, what is higher education and research really for? And for whom?
01 March 2018
Kevin Anderson Living within our carbon budget: the role of politics, technology and personal action
There are a lot of Kevin Anderson talks I am yet to catch up on. This isn't strictly speaking a 'talk'. It has Kevin Anderson talking but with an animation. It is 5 minutes 8 seconds long.
Carbon budgets tell us how much carbon dioxide we can put into the atmosphere while still limiting temperature rise to relatively safe levels. Professor Kevin Anderson explains how technology, politics and personal action each play their part in helping us live within our carbon budget.
Published on 2 May 2017 by the Centre for Environment and Development Studies (CEMUS) in Uppsala, Sweden.
10 February 2018
Kevin Anderson Delivering on the Paris 1.5°C and 2°C goals
Lantbruk 1.5°C - Mat och klimatansvar - a talk by Kevin Anderson. 28 minutes 8 seconds long
Kevin Anderson, Zennström Visiting Professor in Climate Change Leadership, Uppsala universitet, Deputy Director of the UK Tyndall Centre, and Professor of Energy and Climate Change at the University of Manchester.Greenhouse gases are global by nature but, the amount of greenhouse gases that are emitted, and the consequences of their warming effects, differ between countries. For some, climate change is already today a matter of life and death. The fact that the world’s leaders could come to an agreement in Paris gives some hope, but what do the goals of 1,5 or 2°C actually mean in practice?
09 February 2018
Kevin Anderson presentation Ireland Climate Change Laggard
Here is a new Kevin Anderson presentation titled "Ireland Climate Change Leader or Laggard?"
I can't see New Zealand as anything else but just as implicated as Ireland, due to our growth in both gross and net green house gas emissions since 1990.

Subscribe to:
Posts (Atom)