I have created a revised chart of New Zealand's greenhouse gas emissions analysed by economic sector for the years from 1990 to 2015. Something I have done before. Before that I made a chart of just the gross and net emissions.
This first image is an uploaded .png file at actual size (560 pixels wide) which is the width of the text container in the blog's template.

For a comparison, this second image uses Flickr's embed code to show a larger file (1280 pixels wide) I uploaded to Flickr. It's not a very large file; 128 kilobytes. That seems minute, when I am uploading 4MB or larger photographs to Flickr. If I wanted a larger file, I could output the chart from R as a .tiff format file.
The first smaller image uploaded to Blogger seems slightly clearer.
The data source is of course;
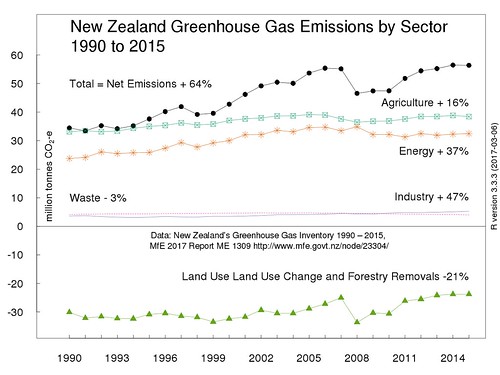
"New Zealand's Greenhouse Gas Inventory 1990–2015", Publication date: May 2017, Publication reference number: ME 1309, Full report - New Zealand’s Greenhouse Gas Inventory 1990-2015, and supporting tables and files. CRF summary data [Excel file, 45.6 KB]
The key difference from previous charts is that I have omitted gross emissions or as the Ministry for the Environment calls them "Gross emissions without Land Use, Land Use Change and Forestry (LULUCF)". Gross emissions frequently if not mostly seem to be the focus of analysis of trends and achievement of targets. Land Use, Land Use Change and Forestry emissions frequently get omitted.
I started with the sector emissions, then I added net emissions. Net emissions are the sum of the sectoral emissions obviously. Net emissions (with a qualification I may address in another post) are what end up in the atmosphere. So from a science-informed viewpoint, analysis of trends should be based on net emissions.
What struck me is that this format highlights a different interpretation of trends. Look how much of NZ's 1990 emissions were 'counter-balanced' by Land Use, Land Use Change and Forestry. In 1990, the land use and forestry sector sequestration (removal) of greenhouse gases was equivalent to the sum of the other sectors excluding agriculture. The 1990 net emissions were the same as the emissions from the agriculture sector. In other words, if you excluded agriculture emissions, NZ's emissions in 1990 would have been 'net zero'.
Since 1990, the land use and forestry sector sequestration has declined by 21%. In 1991, the land use and forestry sector sequestration 'counterbalanced' 100% of non-agriculture emissions. In 2015, the land use and forestry sector sequestration only counterbalanced only 57% of non-agriculture emissions. As long as land use and forestry sequestration is measured consistently over time, this trend can only get worse. A lot of commercial forest planting happened in the 1990s. These forests will soon be due for harvesting. That's why I want to scream each time I hear some pundit say forestry will be a 'get out of jail card' for growing emissions in other sectors, notably agriculture.
Here is the R script (with a couple of Linux Xterminal commands) for obtaining and preparing the data and for creating the chart.
No comments:
Post a Comment