Showing posts with label net emissions. Show all posts

17 March 2023

Explaining the emissions budget it's the bodge that gives the number of emissions units to auction

I feel I need to do a deep dive into emissions budgets.

The emissions budget is the bodge that papers over all the cracks and flaws in the emissions trading scheme. It calculates the number emissions units to auction into the New Zealand carbon market.

Emissions budgets are part of the huge blob that is New Zealand's climate policy framework, along with:

Specifically emissions budgets are a relatively new tool (added in the 2020 reforms) to calculate the amount of emissions units that will be auctioned to emitters under the New Zealand Emissions Trading Scheme. The first auction of emission units was in March 2021.

The Ministry for the Environment's web site has an explanation of how the emissions budgets help calculate the amount of units to auction into the emissions trading scheme each quarter.

The web page features this chart showing the working parts of the emissions budget.

The web page then shows this table of the annual auction volumes.

However, the table and the chart don't match. They cover different five year periods. There is also an error in the html code of the table. There is a blank cell missing in the first row and first column. And the column headings need to be moved one cell to the right so that 'TOTAL' is above '75.2'.

I emailed the Ministry back in mid February to let them know. However, nothing has changed.

I find that quite comical. The web site administrator and the external relations person just got so bored talking with the emission policy person that they fell to sleep. If it's comedy, it's really a tragedy-comedy. One day far in the future, alien anthropologists will discover that the planet Earth missed it's global warming goals because they were too "My Eyes Glaze Over" for any one to understand.

Specifically, the emissions budget is the 2020 provisional emissions budget for the years 2021 to 2025. This comes from a Q and A document attached to a Government media release dated 2 June 2020 Emission trading reforms another step to meeting climate targets by James Shaw Minister for Climate Change Issues.

These five year emissions budgets roll forward as each year passes. So the current emissions budget is 2023 to 2027.

What is the point of the five year emissions budget?

It is to drag down the trend line in New Zealand's gross and net emissions of greenhouse gases. This is helpfully shown by this chart from the Climate Change Commission's advice to the Government. We can see the three jaffa and blue coloured bars representing the three five year budgets 1 , 2 and 3 sequentially reducing and pulling down the trend line of emissions.

This next chart, 'Figure 7' from the Ministry for the Environment presents what looks like an area chart (Except its actually a barplot of five time intervals). Look at the area underneath the black dashed line of net emissions and the solid red line of a trajectory towards the 2030 emissions target. A wedge shaped area of 'additional reductions' is needed to drag the forecast line down to the trajectory to the target. The area under the trajectory (to the target) is 354 million tonnes of net emissions. So the decreases in emissions are squeezed to the later years.

Here is my version of the same bar chart of five years of emissions. It uses the same area 354 million tonnes of net emissions (derived from the 2030 target) and the same colours.

The next step is to add the target trajectory red line and the annual amounts of net emissions from 72 million tonnes in 2022 to 68 million tonnes in 2025.

So, okay, we have an emissions trading scheme. Those 354 million tonnes of greenhouse gases will be represented by 354 million emission units that could be auctioned to emitters. As basic economics says that will be the most efficient way of allocating the emissions to buyers.

Ha ha ha! Of course that's not what is done! Instead we have to do a 'bodge' and subtract millions of tonnes from the emissions budget to deal with the fundamental flaws in the emissions trading scheme.

This is the crux of the problem. However, neither James Shaw or the Ministry for the Environment discuss this 'budgetting' as the crude bodge that it is.

The emissions of pastoral agriculture are not yet subject either to a methane-based emissions levy or to the emissions trading scheme. And perhaps may never be subject to emissions pricing if Beef and Lamb NZ's latest anti-regulation campaign succeeds.

So the first step is a 'bodge' to subtract the emissions of agriculture. This is 194 million tonnes, more than half the emissions budget of 354 million tonnes.

So are the remaining 160 million tonnes going to be auctioned? No, there's another subtraction. Under the emissions trading scheme industrial allocation rules, emissions-intensive industries are given free emissions units...which they then surrender back to the Government.

So those emissions are not priced. Free allocation of units has the same effect as the exemption of agriculture, the units have to be subtracted from the emissions budget as you can't auction units that have already been given for free to emitters. The numbers are 8.6 million units per year or 43 million for 2021 to 2025.

Is that it? No, there's another bodge. There are too many emission units in private hands. There were 164,329,773 emission units at 31 December 2022. This surplus is called the stockpile. These units could be sold into the market at any time. Which would allow more emissions. Thus emissions would exceed the emissions budgets. The Climate Change Commissions and the Government would like to reduce the stockpile. So another 27 million tonnes are subtracted.

Now my chart of the 2020 provisional emissions budget is almost the same as the Ministry of the Environment's chart. That final bodge leaves a budget of 90 million tonnes left to auction into the carbon market. Or 18 million per year. Or 4.75 million emissions units to be auctioned from the first quarterly auction of emission units held on 17 March 2021.

This chart displays the same unit numbers and shows the sum of the bodges, how 264 million tonnes out of 354 million tonnes are not priced through the emissions budget process.

This chart has the same axes as the previous chart but just shows the number of units to be auctioned. Only 90 out of 354 million tonnes of emissions are priced via the auctions.

This chart now summarises the message of the two previous charts. Because the design flaws in the emissions trading scheme require bodges (by subtraction) to the emissions budget, only a quarter (25%) of the 2021 to 2025 emissions budget is expected to be priced via auction sales to emitters.

Summary points to note. The emissions trading scheme has fundamental flaws in it's design:

  1. the exclusion of agricultural emissions from ETS obligation,
  2. the excessively generous industrial allocation of free emissions units to emitters,
  3. the excessive surplus of privately held emission units reflecting the importing of 'hot air' international units.

These three flaws require bodges to the emissions budgetting process that reduce the quantity of emissions subject to an emissions price via auctions.

15 May 2022

The 'Zero Carbon' five year emissions budgets to 2035 will have no effect on emissions

I have whipped up another chart for the five-year emissions budgets for 2022 to 2035.

Remember that the first emissions budget is for 2022 to 2025.

The second emissions budget is for 2026 to 2030.

The third emissions budget is for 2031 to 2036.

This shows both the gross budgets (excluding emissions from land use and forestry and the net budgets (including emissions from land use and forestry).

Where is the 'fat' in the budget? It's in the carbon removals from forestry and landuse in the 2022 to 2025 net budget.

If we look at the Climate Change Commission's breakdown of its recommended budget, we see that they budget for 6.6 million tonnes of emissions in CO2-e for removals or sequestration of carbon from the forests and landuse sector. That's a lowball number.

In calendar year 2020, the official Greenhouse Gas Inventory reports 23 million tonnes of carbon removals from the forests and landuse sector. That's almost four times the annual budget amount.

09 May 2022

Aotearoa sets course to net-zero with first three emissions budgets which are simply underwhelming

James Shaw announced today announced today the five-year emissions budgets for 2022 to 2035 in a media statement Aotearoa sets course to net-zero with first three emissions budgets.

The emissions budgets are;

  • 2022–2025: 290 million tonnes
  • 2026–2030: 305 million tonnes
  • 2031–2035: 240 million tonnes

So I put the emissions budgets and their annual equivalents on a graph along with the latest actual gross and net emissions from the Greenhouse Gas Inventory from 1990 up to 2020.

Did you notice in his statement James Shaw only uses the word 'emissions'? He does not specify if he means gross emissions or net emissions.

Under the Climate Change Response Act the emissions budgets are expressly defined as net emissions. However, there is a conflicting section in the Act stating that the Climate Change Commission may advise the Government on "the rules that will apply to measure progress towards meeting emissions budgets" This was one of the issues the Lawyers For Climate Change Action raised in their recent judicial review of the Commissions advice.

If we take the 2022 to 2025 budget of 290 million tonnes of net emissions and divide by four year we get 72 million tonnes for budget 2025. Comparing the 72 million tonnes of net emissions with 2020's 55.5 million tonnes that is a whopping great increase on 2020 net emissions of 16.5 million tonnes or thirty percent!

If we take the 2031 to 2035 budget of 240 million tonnes of net emissions and divide by five we get 48 million tonnes for 2035. Comparing the 48 million tonnes of net emissions with 1990's 44 million tonnes, that is still an increase on 1990 net emissions of nine percent!

So the three emissions budgets don't even represent reductions in emissions against any historic actual emissions baseline. I find the ambition of these five year budgets utterly underwhelming

25 March 2018

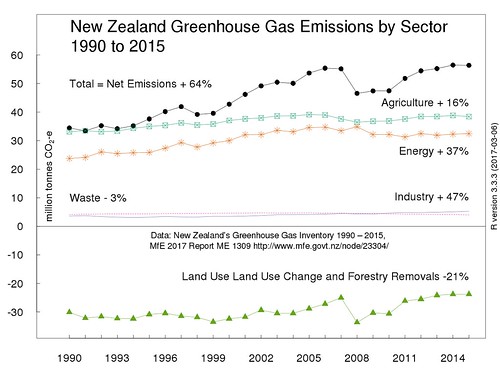
Charting New Zealand Greenhouse Gas Emissions by Sector 1990 to 2015

I have created a revised chart of New Zealand's greenhouse gas emissions analysed by economic sector for the years from 1990 to 2015. Something I have done before. Before that I made a chart of just the gross and net emissions.

This first image is an uploaded .png file at actual size (560 pixels wide) which is the width of the text container in the blog's template.

For a comparison, this second image uses Flickr's embed code to show a larger file (1280 pixels wide) I uploaded to Flickr. It's not a very large file; 128 kilobytes. That seems minute, when I am uploading 4MB or larger photographs to Flickr. If I wanted a larger file, I could output the chart from R as a .tiff format file.

NZ-Net-ghg-sector-2015-1280box

The first smaller image uploaded to Blogger seems slightly clearer.

The data source is of course;

"New Zealand's Greenhouse Gas Inventory 1990–2015", Publication date: May 2017, Publication reference number: ME 1309, Full report - New Zealand’s Greenhouse Gas Inventory 1990-2015, and supporting tables and files. CRF summary data [Excel file, 45.6 KB]

The key difference from previous charts is that I have omitted gross emissions or as the Ministry for the Environment calls them "Gross emissions without Land Use, Land Use Change and Forestry (LULUCF)". Gross emissions frequently if not mostly seem to be the focus of analysis of trends and achievement of targets. Land Use, Land Use Change and Forestry emissions frequently get omitted.

I started with the sector emissions, then I added net emissions. Net emissions are the sum of the sectoral emissions obviously. Net emissions (with a qualification I may address in another post) are what end up in the atmosphere. So from a science-informed viewpoint, analysis of trends should be based on net emissions.

What struck me is that this format highlights a different interpretation of trends. Look how much of NZ's 1990 emissions were 'counter-balanced' by Land Use, Land Use Change and Forestry. In 1990, the land use and forestry sector sequestration (removal) of greenhouse gases was equivalent to the sum of the other sectors excluding agriculture. The 1990 net emissions were the same as the emissions from the agriculture sector. In other words, if you excluded agriculture emissions, NZ's emissions in 1990 would have been 'net zero'.

Since 1990, the land use and forestry sector sequestration has declined by 21%. In 1991, the land use and forestry sector sequestration 'counterbalanced' 100% of non-agriculture emissions. In 2015, the land use and forestry sector sequestration only counterbalanced only 57% of non-agriculture emissions. As long as land use and forestry sequestration is measured consistently over time, this trend can only get worse. A lot of commercial forest planting happened in the 1990s. These forests will soon be due for harvesting. That's why I want to scream each time I hear some pundit say forestry will be a 'get out of jail card' for growing emissions in other sectors, notably agriculture.

Here is the R script (with a couple of Linux Xterminal commands) for obtaining and preparing the data and for creating the chart.

17 June 2017

New Zealand greenhouse gases by sector from the inventory

I have made another chart from the New Zealand's Greenhouse Gas Inventory 1990–2015 released the other week by the Ministry for the Environment.

It shows the greenhouse gas emissions by sectors of the economy. It includes 'negative' emissions, more properly called carbon removals, or carbon sequestration or simply carbon sinks. This is the sum of all the carbon dioxide taken out of the atmosphere by the sector of the economy called Land use, Land use change and Forestry.

Here is the chart.

This time I took a more traditional R approach to getting the the data into R from the Excel file CRF summary data.xlsx.

First, I used opened an X terminal window, and used the Linux wget command to download the spreadsheet "2017 CRF Summary data.xlsx" to a folder called "/nzghg2015".

I then used ssconvert (which is part of Gnumeric) to split the Excel (.xlsx) spreadsheet into comma-separated values files.

The Excel spreadsheet had 3 work sheets, 2 with data, and 1 that was empty. So there's now a .csv file for each sheet, even the empty sheet. And we read in the .csv file for emissions by sector.

The final step is to make the chart.

13 January 2016

NZ greenhouse gas emissions march steadily onwards and upwards to 2030

A previous post was about an inaugural press release from the new Minister for Climate Change Paula Bennett.


From a public relations point of view Bennett's release aimed to sow and spread and cultivate 'talking points' that support the Government's preferred climate policy narrative. Which is of course that:

New Zealand is doing enough on reducing anthropogenic greenhouse gas emissions. New Zealand complies with its climate target obligations (via 'carbon credits') under the Kyoto Protocol and the UNFCCC. New Zealand has a moderated balanced emissions trading scheme and is doing research on agriculture and helping out in the Pacific and 'punching above our weight' in the international negotiations. All in all New Zealand is doing enough about climate change!

However, New Zealand (irrespective of who was in Government) has historically always sought to use loopholes to comply with emission reduction targets.

So for the talking point "We are meeting our obligations", the reality is "we used creative carbon accounting to obscure the fact that gross and net emissions of greenhouse gases have increased by 21% and 42% since 1990 respectively".

One of the reports referred to by Paula Bennett was the Second Biennial Report to the UNFCCC. This included a spreadsheet of data on projected New Zealand emissions until 2030. So of course I had to create a graph of it.

NZ greenhouse gases by sector

The creative commons license is CC BY-SA 4.0

I used the R programming language and the script is available on the Wikimedia Commons page. Anyone is free to use the graph, it is licensed under the Creative Commons Attribution-Share Alike 4.0 International licence, via Wikimedia Commons

Categorising the emissions by sectors of the economy makes it very clear that pastoral agriculture by far and away contributes more than any other sector. Emissions from agriculture are twice as large as the second largest sector, energy. I added the projected growth of each industry sector by percent since 1990; agriculture, + 22%; energy, + 19%; transport + 60%; industry + 101%; waste, + 4%.

The upward emissions trend is in stark contrast to the Ministry for the Environment's web page on how New Zealand is meeting the 2020 emissions reduction target.

20 December 2015

Minister for Climate Change Paula Bennett's first act is confirming 'Hot Air' creative accounting with surplus Kyoto Protocol units

New Zealand's new Minister for Climate Change Issues, Paula Bennett, has just confirmed New Zealand will be "carrying forward" 127 million "Hot Air" emissions units (or offsets) under the Kyoto Protocol rules. These units mostly do not represent a tonne of carbon dioxide equivalent reduced somewhere else and yet the Government intends to use them to allow New Zealand's greenhouse gas emissions to continue to increase.

On Thursday 17 December 2015, Ms Bennett released a statement stating that New Zealand had met it's 2008 to 2012 Kyoto Protocol emissions reduction target and was well on the way to meeting the 2013 to 2020 target.

The Minister's statement linked to four reports on the Ministry for the Environment's website;

  1. the Biennial report and net position snapshot 2015,
  2. the Biennial Report to the United Nations Framework Convention on Climate Change,
  3. the Report upon expiration of the additional period for fulfilling commitments by New Zealand and finally
  4. the updated Latest update on New Zealand's 2020 net position

.

In two scathing posts No Right Turn assesses the dubious use of the Ukrainian and Russian units derived from coal stockpile projects; Climate change: A policy based on fraud and Climate change: How bad is New Zealand's climate fraud?.

My previous estimate of the amount of surplus units was 86 million units. The reports confirm 127 million units. I did a back-of-envelope calculation to relate the numbers of units cancelled (to match 2008 2012 emissions) and the numbers left over as 'surplus' which may be carried forward.

The updated Latest update on New Zealand's 2020 net position explicitly confirms that New Zealand is 're-using' the surplus units in assessing compliance with the 2020 target of a 5% reduction in emissions from a 1990 gross emissions base. So we will 'meet' the 2020 target in spite of projected increases in both gross emissions and net emissions. Gross emissions in 2020 are estimated to be 83 million tonnes, or 24% higher than 1990's 67 million tonnes of carbon dioxide equivalent. Net emissions in 2020 are estimated to be 59 million tonnes, or 54% higher than 1990's 38 million tonnes.

Manipulating accounting rules like this, so that an adverse trend is systematically misrepresented is as it's opposite, a positive trend - is the text-book definition of creative accounting. I agree with No Right Turn that this is another example of New Zealand's completely unethical climate change policy.

16 January 2013

The Kyoto New Zealand break-up - when unfaithful New Zealand said 'commitment' he never meant it

In this post I argue the best analogy for New Zealand's choice to opt out of a second commitment period (of reducing emissions) under the Kyoto Protocol - is: unfaithful men who won't commit to their partners!

New Zealand governments have behaved faithlessly towards Kyoto. The current National Government under Climate Minister Tim Groser won't commit to the Kyoto Protocol stage 2. And the 1990s National Government gave a commitment they had no intention of being faithful to. New Zealand politicians and diplomats intentionally negotiated the Kyoto Protocol so that New Zealand's Kyoto target would be met without reducing either gross or net emissions of greenhouse gases

I have argued before that New Zealand did not sign the Kyoto Protocol in good faith. As we seem unable to commit to Kyoto stage 2 in good faith, I have had another look at how faithful New Zealand's position was right from the the beginnings of Kyoto Protocol negotiations and at ratification in 2002.

According to a UNFCCC account of the Kyoto negotiations 'Tracing the Origins of the Kyoto Protocol: An Article-by-Article Textual History' on page 48;

"New Zealand was the only Party which made an early, more comprehensive proposal on the treatment of sinks, suggesting that sequestration of greenhouse gases from certain listed categories should be added to a Party's emission budget" (paragraph 226)
"New Zealand...faxed through a proposal for the treatment of sinks...sinks would not be included in a Party's baseline, but removals would be credited to a Party's budget (the so-called 'gross-net' approach)." (para 227)

(NB 'Sinks' meaning forests or land-use or land-use-change that sequesters carbon dioxide from the atmosphere. So the New Zealand diplomats were 'ahead of the curve' in negotiating to get forest sinks recognised so they could offset other emissions.)

In October 1997,three weeks before the UNFCCC meeting in Kyoto, Simon Upton, the Minister for the Environment in Jim Bolger's National Government said in a speech:

"New Zealand has long been advocating" for Kyoto rules where "removing carbon from the atmosphere in future years will earn us credits"

Let's look at the advice the Ministry of Foreign Affairs and Trade gave the government in February 2002, prior to New Zealand ratifying Kyoto that year. It was in a document called National Interest Analyses - Kyoto Protocol Part II

"New Zealand has an initial assigned amount for the first commitment period currently estimated to be 365 million tonnes of carbon dioxide-equivalent. That is, New Zealand is allowed to emit 365 Mt of carbon dioxide (or equivalent in other gases) over the years 2008 to 2012...New Zealand is expected to emit between 50 and 75 million tonnes over its 365 Mt initial assigned amount during the commitment period...."
"Current estimates are that, during the commitment period: New Zealand will emit between 415 million and 440 million tonnes of carbon dioxide equivalent, and New Zealand sink activities (derived from forests planted from 1990 onwards) will provide an additional 110 million units of assigned amount, in the form of removal units."
"At a national level, New Zealand is therefore expected to have a surplus of assigned amount over emissions of between 35 and 60 million units over the five years of the first commitment period."

So the Ministry of Foreign Affairs and Trade were saying:

  1. New Zealand's greenhouse gas emissions would increase (not reduce) through to 2012.
  2. New Zealand would meet its Kyoto target by issuing itself additional forest sink removal units.
  3. New Zealand would make an economic gain from having a surplus of emission units.

So New Zealand would meet a 'trifecta' of Kyoto-related goals, none of which were reduced gross or net emissions.

The Ministry of Foreign Affairs and Trade were especially proud of that last point, making a profit.

"New Zealand’s effectiveness in climate change negotiations means it is one of the few developed countries that stands to make a small net economic gain from the first Kyoto Protocol commitment period."

So what would the Ministry of Foreign Affairs and Trade's predicted increased emissions and forest removal units look like on a chart? Assuming the maximum 75 million tonnes of carbon dioxide equivalent greenhouse gases is represented by a linear increase of 0.94% p.a. from a base of 73 million tonnes in 1990, and the forest removal units are issued equally over 2008 to 2012, it looks like this.

This is what 'gross-net Kyoto accounting' of emissions and emission units looks like. From 1990 to 2007, gross (or total emissions - blue dots) are the same as "Kyoto" emissions (the red dots). However, from 2008, you get the "Kyoto" emissions by subtracting carbon dioxide removed by 'human induced afforestation, reforestation and deforestation' (the violet dots) from the gross emissions. And the red dot Kyoto emissions suddenly dive under the 1990 baseline, even though both net and gross emissions have increased.

Except for the straight line, which is from my linear growth assumption, that looks very much like the current gross, net and Kyoto emissions, which I update below in a brand new animated 'Kyoto Escalator' chart

It's interesting to note that in the Ministry for the Environment's November 2012 calculation of the net Kyoto Protocol position, that although the ministry predicts a surplus of units (exceeding the target), this will happen in spite of an estimated 80% increase in annual net emissions since 1990 and a 27% increase in gross emissions. The actual gross and net emissions to 2010 have grown by 19% and 59% respectively, as shown in this chart

This is why whenever we hear Tim Groser or Nick Smith claim the New Zealand is meeting it's Kyoto target, we need to realise they are being the ultimate uncommitted unfaithful partner; in spite of their smooth rhetoric of caring about global warming, New Zealand's gross and net greenhouse emissions are showing an increasing trend. New Zealand needs to adopt policies that really do just stop emissions.

NB The original meme is Kyoto New Zealand break-up and all the images are at Picasa at Kyoto's Break-up with New Zealand where they can be viewed as a slide show. Feel free to use them and make up some more.