03 November 2022

Industrial allocation - free emissions units given to emitter industries in New Zealand

What is Industrial Allocation?

The Ministry for the Environment says

Allocations of New Zealand Units are given to businesses carrying out certain activities.

I prefer what Motu Research say. That one (out of five) ways of allocating emissions units in an emissions trading scheme is industrial allocation; which Motu define as

"Receiving them (emissions units) for free"

(See Leining, Catherine and Suzi Kerr. 2018. A Guide to the New Zealand Emissions Trading Scheme. Report prepared for the Ministry for the Environment. Wellington: Motu Economic and Public Policy Research)

I have posted in detail about industrial allocation to New Zealand Steel and to New Zealand Aluminium Smelters Limited

In both cases I argued that both companies were being over-allocated units. That these transnational corporates were given far too many emission units, well in excess of their direct (or Scope 1 emissions). And that such excessive allocations of units not only removed any price signal, they insulated the emitter from any emissions trading scheme price signal.

This over allocation is because the emissions factors used to calculate the unit allocations (allocation baseline) include overly generous compensation (extra units) for upstream energy cost increases caused by the NZ emissions trading scheme.

This concept of emissions trading scheme costs embedded in energy or electricity supplies is called the "Electricity Allocation Factor".

The Ministry for the Environment explicitly states that Industrial Allocation does not remove the price signal or result in over-allocation of units.

Businesses still face NZ ETS costs for a proportion of the emissions stemming from the activity. For example; highly emissions intensive firms face NZ ETS costs of 10% of their emissions

That statement asks you to ignore the extra emissions units allocated for these upstream ETS related energy costs. In the cases of NZ Steel and NZ Aluminium the ETS energy cost calculations result in far more units than 10% being allocated. Both NZ Steel and NZ Aluminium receive more emissions units than they surrender. They are almost always net sellers of units and not net buyers.

However, I want to look at Industrial Allocation in the round. How many emissions units have been given away since 2010? Is it a big number?

The Environmental Protection Authority annually publish data on the final industrial allocation of emissions units. So some analysis can be done.

How many units? The answer is fifty five million or 55,001,914 emissions units have been given away from 2010 to 2020.

This bar plot shows the 55 million emissions units year by year.

I will come back to the question 'is 55 million a big number?' in another post. Another question raised by the bar plot is 'why does the annual allocation increase after 2016? I will come back to that too.

25 June 2022

Should a major emitter like New Zealand Steel Limited be accumulating emissions units under the emissions trading scheme?

In this post I revisit and update the analysis of the free emissions units received by New Zealand Steel Limited under the 'Industrial Allocation' rules of the New Zealand Emissions Trading Scheme.

Every year since the New Zealand Emissions Trading Scheme (or "ETS") began, New Zealand Steel Limited has received more emissions units under the Industrial Allocation rules then it has had to surrender to the Government for it's emissions.

New Zealand Steel Limited is therefore always a net seller of emissions units (if it chooses to sell).

New Zealand Steel Limited also alway has an annual surplus of emissions units. This surplus may accumulate if New Zealand Steel Limited chooses to hold.

Should the emissions trading scheme result in New Zealand Steel Limited accumulating a stockpile of emissions units?

In a sensibly designed emissions trading scheme, shouldn't the 'flow' of emissions units be from the emitter, New Zealand Steel, to the Government?

Here is a graph of the greenhouse gas emissions of the New Zealand steel sector from the Greenhouse Gas Inventory. The emissions do not vary much over time. I assume that is because production in the Glenbrook steel smelter is also consistent from year to year.

I know these emissions are from the New Zealand Steel Limited's steel smelting plant in Glenbrook as I looked up New Zealand Steel's actual calendar year 2020 emissions in the EPA report "ETS Participant Emissions" October 2021. New Zealand Steel's reported emissions are (steel 54,431 + stationary energy 762,038 + coal purchase 736,875 equals) 1,553,344 tonnes.

I have marked that data point with a purple circle. The 2020 GHG Inventory steel emissions are 1,578,554; the green circle. The purple and green data points overlap on the graph. So I think it's reasonable to use the GHG Inventory steel industry emissions as an estimate of New Zealand Steel's actual emissions from 1990 to 2020.

Here is the same graph but with the industrial allocation of free emissions units added.

The free emissions units don't seem to relate logically to the steel emissions. The free units seem to be roughly half of the emissions until 2016 then the free units increase anually until they are greater than the emissions in years 2018 2019 and 2020. What's going on?

There is another variable to take into account. In 2009 Minister for Climate Change Issues Nick Smith introduced the '1 for 2' surrender obligation which halved the unit surrender liability of emitters. It was part of the 'transitional measures' which were to end after 2012 (to coincide with the end of the Kyoto Protocol commitment). Here is a screen capture of a summary of Smith's amendment of the emissions trading scheme.

In 2012, the then Minister Tim Groser indefinitely extended the "one for two" deal where non-forestry participants in the ETS had to surrender one eligible unit for every two tonnes of emissions.

After a 2016 review, this discount was phased out from 2017. See this screen capture from the EPA's website.

The phase out; 2017; 1 unit for each 1.5 whole tonnes of emissions, 2018; - 1 unit for each 1.2 whole tonnes of emissions. And finally in 2019; the ETS gets to 1 unit for each 1 whole tonne of emissions.

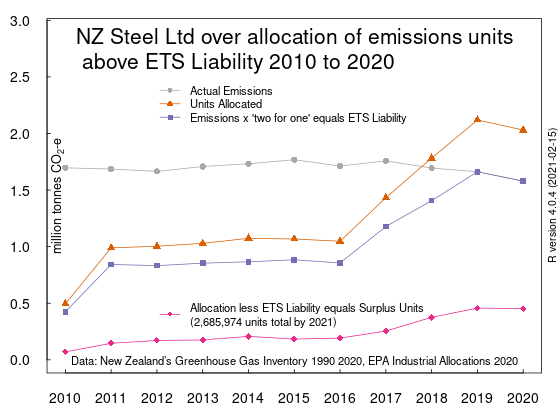
So I need to factor in the discount to estimate the actual liability to surrender units under the Emissions Trading Scheme. That is steel emissions multiplied by a discount factor (0.25 units for a tonne of emissions in 2010 as the ETS applied for half of 2010, 0.5 for 2011 to 2016, 0.67 for 2017, 0.83 for 2018, 1 unit per tonne for 2019 and 2020). I have added the ETS liability in blue lines and square points

Well what do you know? The annual allocation of free emissions units always exceeds the ETS liability to surrender units. New Zealand Steel Limited has never had to surrender any emission units under the ETS. New Zealand Steel Limited is always a net seller of emissions units.

The rationalisation for the annual surplus of units over ETS liability is that New Zealand Steel Limited's 'Allocation Factor' for steel smelting includes an 'Electricity Allocation Factor'. This factor includes the costs associated with the NZ ETS that are expected to flow to eligible firms through electricity prices. So the industrial allocation of units exceeds direct steel smelting emissions. Therefore the carbon price that New Zealand Steel is exposed under the ETS is through the costs of it's electricity supply contracts.

I think that this electricity ETS pass-through cost is an imaginary artefact. It can only be detected by 'modelling'; that is to say fiddling numbers on a spreadsheet. It is confused with coal fired generation setting the marginal cost of electricity in the wholesale market. I think it is implausible that a high-volume contract for electricity supply negotiated by a large corporate such as New Zealand Steel with market power includes any carbon price pass-through cost.

The next graph shows the annual excess or surplus of allocated emission units over the estimated number of emissions units actually surrendered back to the Government.

Back in 2016, I asked why does the Emissions Trading Register show that New Zealand Steel Limited owned over 1 million emission reduction units (internationally sourced, bargain priced and probably fraudulent 'hot air' units) at the end of 2013 and 2014, given it never needed to buy emissions units to meet it's ETS obligations?

The answer is that New Zealand Steel intentionally made windfall arbitrage profits. I argued they would have surrendered the much cheaper "hot air" emission reduction units to the Government for its steel emissions in 2013 and 2014 and stockpiled the more valuable (and permanent in duration) NZUs (New Zealand Units).

Lets add the emission reduction units to our chart as teal green points (and lines) in 2013, 2014 and 2015.

The point being that these units just add to the growing 'stockpile' of units owned by New Zealand Steel. In this next chart I have added the growing stockpile as the red line, resized the Y axis and I have 'grayed out' the annual emissions, the allocations, the ETS surrender liability and the annual surplus of units.

The two biggest annual increases in the stockpile are 2013 and 2014 when New Zealand Steel bought the cheap ERUs and stockpiled the allocated NZUs.

If New Zealand Steel surrendered the cheaper ERUs for it's ETS liabilities and kept all surplus NZU emission units, they would own 4.7 million units at the end of 2020. For their 2022 stock of units that is an under estimate as New Zealand Steel has been allocated more units in May 2021 and in May 2022. The 4.7 million units will have a current market value of $364 million based on a carbon price of $76.90

So my final question is: How can accumulating a holding of emission units worth $364 million possibly be a sensible outcome from a policy intended to incentivise the reduction of greenhouse gas emissions? Instead, the emitter ends up with a financial asset making considerable capital gains and unrealised capital gains income. The effect of the emissions trading scheme is extra annual income to New Zealand Steel - instead of a cost/carbon price. How is this possibly compatible with a net zero in 2050 policy?

15 May 2022

The 'Zero Carbon' five year emissions budgets to 2035 will have no effect on emissions

I have whipped up another chart for the five-year emissions budgets for 2022 to 2035.

Remember that the first emissions budget is for 2022 to 2025.

The second emissions budget is for 2026 to 2030.

The third emissions budget is for 2031 to 2036.

This shows both the gross budgets (excluding emissions from land use and forestry and the net budgets (including emissions from land use and forestry).

Where is the 'fat' in the budget? It's in the carbon removals from forestry and landuse in the 2022 to 2025 net budget.

If we look at the Climate Change Commission's breakdown of its recommended budget, we see that they budget for 6.6 million tonnes of emissions in CO2-e for removals or sequestration of carbon from the forests and landuse sector. That's a lowball number.

In calendar year 2020, the official Greenhouse Gas Inventory reports 23 million tonnes of carbon removals from the forests and landuse sector. That's almost four times the annual budget amount.

09 May 2022

Aotearoa sets course to net-zero with first three emissions budgets which are simply underwhelming

James Shaw announced today announced today the five-year emissions budgets for 2022 to 2035 in a media statement Aotearoa sets course to net-zero with first three emissions budgets.

The emissions budgets are;

  • 2022–2025: 290 million tonnes
  • 2026–2030: 305 million tonnes
  • 2031–2035: 240 million tonnes

So I put the emissions budgets and their annual equivalents on a graph along with the latest actual gross and net emissions from the Greenhouse Gas Inventory from 1990 up to 2020.

Did you notice in his statement James Shaw only uses the word 'emissions'? He does not specify if he means gross emissions or net emissions.

Under the Climate Change Response Act the emissions budgets are expressly defined as net emissions. However, there is a conflicting section in the Act stating that the Climate Change Commission may advise the Government on "the rules that will apply to measure progress towards meeting emissions budgets" This was one of the issues the Lawyers For Climate Change Action raised in their recent judicial review of the Commissions advice.

If we take the 2022 to 2025 budget of 290 million tonnes of net emissions and divide by four year we get 72 million tonnes for budget 2025. Comparing the 72 million tonnes of net emissions with 2020's 55.5 million tonnes that is a whopping great increase on 2020 net emissions of 16.5 million tonnes or thirty percent!

If we take the 2031 to 2035 budget of 240 million tonnes of net emissions and divide by five we get 48 million tonnes for 2035. Comparing the 48 million tonnes of net emissions with 1990's 44 million tonnes, that is still an increase on 1990 net emissions of nine percent!

So the three emissions budgets don't even represent reductions in emissions against any historic actual emissions baseline. I find the ambition of these five year budgets utterly underwhelming

26 April 2022

Megan Woods announces grants to decarbonise industry coal and gas boilers that the ETS has subsidised for twelve years

Why does New Zealand's emissions trading scheme (ETS) involve twelve years of subsidies to businesses to keep fossil fuel heat sources before the Government can provide a subsidy to replace the same fossil fuel heat sources with carbon-free renewable heat sources?

The curious case of the third round of grants under the Government Investment in Decarbonising Industry Fund.

Have you seen the Minister for Energy the Hon Dr Megan Woods' media statement of today?

"Helping some of New Zealand’s highest energy users slash their emissions"

It's about the third round of grants under the Government Investment in Decarbonising Industry Fund. This is a subsidy to encourage energy users to move from fossil fuel thermal to renewable thermal energy sources. To help the recipient companies replace coal, oil or gas in their thermal boilers with renewable fuels. Fair enough! Great! What's not to like?

The "elephant in the room" level policy inconsistency is that three of the recipients Minister Woods mentions have also been receiving free allocations of emissions units since 2010 - which are an incentive to keep the same fossil fuel boilers that they are now getting grants to replace!

We can see which businesses from the Government Investment in Decarbonising Industry Fund grant scheme have also been receiving free emissions units by cross referencing the the Environmental Protection Authority spreadsheet of final industrial allocations.

The three are:

  1. Southern Paprika Limited, GIDI grant; $4,979,520, ETS free emissions units 83,061 2010 to 2020 worth $1,374,001, 14233 units in 2020.
  2. Blue Sky Meats (N.Z.) Limited, GIDI grant; $377,250 ETS free emissions units 6134 units 2010 to 2020, 1122 units in 2020.
  3. Gourmet Paprika Limited, GIDI grant; $575,250, 43962 units 2010 to 2020, 6909 units in 2020.

We know from the Government Investment in Decarbonising Industry Fund third round of grants that:

Southern Paprika is NZ’s largest single site capsicum grower near Auckland , privately owned by the Alexander and Levarht families. Over the last 22 years, the site has grown to 26 hectares of glass houses, and employs around 160 people locally and from the Pacific Islands.

Southern Paprika's project is to install New Zealand’s first CO2 recovered biomass boiler.

Here is a barchart of the 83,061 emission units allocated to Southern Paprika Limited.

Each of the three companies has probably received a 'provisional' allocation in 2021 and may still be eligible for another provisional allocation for 2022. So each company has been receiving free emissions units for the last twelve years because they have fossil fueled thermal boilers as a part of their operations. Usually as a heat source.

Two of the three companies are exporters of 'hothouse' grown vegetables. They are deemed to be at a competitive disadvantage as in theory their energy costs have increased and as there is the very distant prospect that they have international competitors in a country with no emissions pricing.

They are not even participants in the Emissions Trading Scheme who have an obligation to report emissions and an obligation to surrender units to the Government.

The free allocation of emissions units is not balanced out by any return of emissions units back to the Government under the ETS. It is a straight-out transfer of economic value to the companies. It's a subsidy.

Here is a barchart of the market value of the emission units allocated to Southern Paprika Limited. I used a mid May spot price as that is the approximate date the EPA transfers the provisional allocation. The sum of the May priced allocations is $1,374,001.

It is possible that Southern Paprika Limited has not sold any of it's 83,061 emission units and that they are part of the 'stockpile' of 158 million surplus emissions units recorded on the Emissions Units Register.

In that case the market value of the units is 83,061 x $76.60 equals $6,362,473.

I will just clarify what I mean by saying the emissions trading scheme rewards the maintenance of fossil fueled heat sources. If any of the three companies replaced a fossil thermal boiler with a renewable thermal boiler they would no longer be eligible for the free emissions units. They would lose the allocation of units and be worse off financially.

The freeby emissions units are in fact an incentive to keep the fossil thermal boilers. Yes, the emissions trading scheme is subsidizing the use of a fossil fueled industrial heat source by the three companies.

A question I might email the Minister is to ask is "how is it good emissions reducing policy to provide an incentive for keeping thermal boilers for 11 years then immediately move to a subsidy for replacing the thermal boilers with renewable energy?"

Or "will any of the three companies receive in the same year a subsidy of free units (incentivising keeping the fossil thermal boilers) and a subsidy to replace the boilers with renewables from the GIDI fund?"

Why couldn't the Government have gone straight to a subsidy to install renewable energy boilers in 2010?

Sometimes I can't believe how badly coordinated some of our climate change policies are.

27 March 2022

Emissions trading scheme subsidy New Zealand Aluminium Smelters Limited were given 12 million emissions units worth $220 million since 2010

The overly generous treatment of New Zealand Aluminium Smelters Limited under the New Zealand emissions trading scheme has been in the news lately. The subsidy of free emission units has been reduced by the Government. Some data exploration shows that New Zealand Aluminium Smelters Limited were given 12 million emissions units worth $220 million since 2010. Here is the data and some charts.

I have just been doing some charts of the latest data of 'industrial allocation' of free emission units to New Zealand Aluminium Smelters Limited.

I have previously posted a few times about the generous over allocation of emissions units to New Zealand Aluminium Smelters Limited. There is a good summary in this post.

Back on Thursday 24 March 2022, New Zealand Aluminium Smelters Limited and their emission unit allocations were again in the news.

Amazingly, the degree of the over-allocation of emissions units has just been reduced by Minister for Climate Change James Shaw and the Ministry for the Environment who have released a Cabinet paper on the issue.

The Nick Smith National Government narrative in 2011 for the free allocation is that New Zealand Aluminium Smelters Limited are "emissions intensive trade exposed" and they therefore qualify for a 90% "level of assistance". As indicated on the EPA webpage on Eligibility for industrial allocations.

Which implies that the company still pays a 10% obligation when surrendering units under the emissions trading scheme.

But that doesn't happen as the allocation of units also includes compensation for fictitious emissions trading scheme electricity pass-through costs.

Which means that the free allocation of units has always exceeded the amount of units liable to be surrendered under the emissions trading scheme.

That means that NZ Aluminium Smelters has always been a net seller of emissions units. My initial calculations were that the over allocation ranges from 120% to 146%.

The key point of the latest media attention is that James Shaw got a paper through Cabinet which set the "ETS carbon cost", of the recently renegotiated electricity supply contract with (100% renewable hydro powered) Meridian Energy and the company, at zero. That reduced the annual free allocation to the smelter company by 934,400 emissions units (see paragraph 38 of the Cabinet paper). At a 24 March carbon price of 73.10 that's a market value of $68,304,640. Yes, $68 million dollars!

That makes the decision probably the most effective single decision ever taken to reform the woeful emissions trading scheme into a real emissions-reducing policy.

Idiot/Savant posts at No Right Turn on 25 March 2022 that: "Under the ETS's industrial allocation provisions, it [NZ Aluminium Smelters Limited] receives far more carbon credits than it actually emits, which it can then sell to other polluters for profit."

Henry Cooke at the Dominion Post 25 March 2022 says; "The Government has removed a complex, subsidy worth about $60m, from New Zealand Aluminium, which runs the Tiwai Point Smelter in Southland"

Marc Daalder of Newsroom reported on 26 March that "...the smelter receive around 600,000 New Zealand Units (NZUs) - carbon credits used in the Emissions Trading Scheme (ETS) - each year for the next four years, down from around 1.5 million that it would have otherwise been granted".

My analysis is on its own github repository along with the data, the 'R language' script and a couple of charts.

Here is the chart showing that New Zealand Aluminium Smelters Limited received 11,946,759 emissions units from 2010 to 2021. Lets call that 12 million emission units.

My understanding is that New Zealand Aluminium Smelters Limited will have an application for a 'provisional' allocation of units approved after April each year by the EPA. The EPA timeframe/deadline for these applications is 1 January to 30 April of each year.

I have therefore assumed that the transfer of emissions units on the New Zealand Emissions Trading Register happens in May of each year. So I valued the annual allocations with a mean mid May NZU price from Theecanmole. (2016). New Zealand emission unit (NZU) monthly prices 2010 to 2016: V1.0.01 [Data set]. Zenodo.

Obviously the NZU price has varied enormously from less than $3 in 2013 to $86 in mid February 2022. The sum of all the annual values is $220,533,810. Lets call that $220 million.

Here is the chart of the annual values of emissions units gifted to New Zealand Aluminium Smelters Limited.

10 December 2021

Six ways the New Zealand emissions trading scheme fails to cap emissions

Back in June 2020, the Minister for Climate Change James Shaw released a statement criticising previous (National) governments for their management of the New Zealand emissions trading scheme. He said:

"the rules set by previous Governments left the scheme too weak to have any real impact on reducing our emissions."

Specifically Shaw said that the emissions trading scheme under National was "a cap and trade system without a cap."

Shaw concluded;

This has meant that emissions permitted under the scheme were, in effect, unlimited. I am delighted to say we are finally changing that.

So that's a great policy win isn't it? Cap and trade emissions trading is very simple really. And we have a Minister who 'gets it'.

Emissions trading schemes, although an exceedingly obtuse subject, can be explained in a single sentence.

"Cap and trade sets a maximum level of pollution, a cap, and distributes emissions permits among firms that produce emissions" (Grantham Institute).

Or;

"The government limits the supply of emission units into a trading market which then sets the emission price based on unit supply and demand" (Motu Research).

So an emissions trading scheme is all about scarcity of emissions permits. The cap.

So hey we are lucky to have a Minister for Climate Change who is well informed and well prepared and who is pushing through the obvious fixes, such as the lack of a cap, to the National Party's woeful emissions trading scheme.

However, there is a problem with this narrative from James Shaw that he has introduced a cap into the emissions trading scheme. It is factually wrong.

The New Zealand emissions trading scheme is still awash with excessive quantities of emission units. While these surpluses of emissions units remain available to buyers, the emissions trading scheme can in no way be described as capping emissions.

There are far too many surplus units in the NZ emissions trading scheme

There are six ways the New Zealand emissions trading scheme has too many units. A real cap on units means scarcity and demand being constrained to a limit on supply to a market. The six ways all involve variations on the theme of too many emission units. The emissions trading scheme in 2022 is still "a cap and trade system without a cap". This post now lists the six ways the scheme fails to limit emissions.

One - the enormous quantity of privately held units in the New Zealand emissions trading register

There are 158 million privately owned emission units recorded in the New Zealand emissions trading register run by the EPA.

Here is a chart of international emissions units accumulating in the Emissions Units Register because of the unlimited importing of units up to 2014

How did that happen?

Brian Fallow of the Herald wrote on 28 May 2014 that:

"..the collapse in international carbon prices has presented the smokestack sector with an arbitrage opportunity too. They have been able to hoard their NZUs, in the expectation they will be more valuable in the future, and meet their obligations in the meantime with cheap imported Kyoto units instead"

On 31 August 2015, Carbon forest consultant Ollie Belton said this;

"In 2012-2015 when the flood of Russian and Ukrainian ERUs were released, the tiny NZ ETS became the last market accepting them. This collapsed the NZ ETS price of carbon from about NZ$20/unit to about 20c/unit. NZ emitters naturally responded by meeting their surrender obligations with ERUs at a negligible cost (while back pocketing NZUs and making big arbitrage profits)."
"..trade exposed industries that were gifted up to 90% of their surrender obligations were able to meet all their obligations with the super cheap ERUs and bank the gifted NZUs. Since 2012, NZUs have had much higher market value than ERUs, generally more than five times as high, hence the arbitrage opportunity. Never have polluters had it so good. They have made hundreds of millions in arbitrage profits."

Dr Suzi Kerr of Motu said in 2016 that

"because of arbitrage, ETS participants now hold an excessive number of units that the government is required to accept against future emissions,”

By "arbitrage", Dr Kerr means the importing of fraudulent Russion and Ukrainian 'hot air' units into the emissions trading scheme described in the Morgan Foundation's Climate Cheats report. New Zealand Steel Limited were up to their necks in arbitrage.

These units are available to be sold to emitters for surrendering back to the Government at any time. They trump the so-called "cap".

Two - industrial over allocation of free emissions units

The free allocation of huge quantities of emissions units to large corporates like New Zealand Steel Limited and New Zealand Aluminium Smelter Limited under section 81 and section 83 of the Climate Change Response Act 2002 is production or output based. The emitters have always received more units than they need to surrender. Way more than a 90% entitlement.

Each year they receive a 'provisional' allocation of units which is calculated as their actual production from the previous year multiplied by the provisional allocative baseline. At year end they submit a 'final adjustment' return to the EPA once they know their actual output. The final units allocated to emitters equals their output multiplied by emissions factors. This process happens irrespective of any "cap" claimed by James Shaw. Free allocation trumps the "cap".

Three - price caps come at the expense of quantity caps - the cost containment reserve

The Ministry for the Environment's recent report "Te hau mārohi ki anamata | Transitioning to a low-emissions and climate-resilient future: Have your say and shape the emissions reduction plan." states on page 37 in footnote 14

"The cost containment reserve (CCR) is a reserve volume of units available to be released to the NZ ETS market if the CCR trigger price is hit at auction."

Auctioning of emissions units was another measure introduced in the June 2020 amendments to the emissions trading scheme.

Stuff's Olivia Wannan describes the cost containment reserve as

"a trigger to prevent the carbon price from going too high. If enough people place a unit bid above $50 during the auctions, the Government can sell an additional 7 million units. These equate to 7 million tonnes of additional climate pollution, which could be created this year or at any point in future."

Sure enough, during the September 2021 auction, the emissions unit price reached $50 per tonne and the additional 7 million units were released and sold to bidders at a price of $53.85.

So, again, the cost containment reserve is a farce that increased the supply of units to the market in spite of Minister Shaw's claim of a "cap" on units.

Four - The emissions budget is done backwards by subtracting the exceptions from the ETS

The New Zealand emissions budget for the 5 years 2021 to 2025, required by the Zero Carbon bill, was done backwards. It calculates by the sleight of hand of subtraction. It takes the emissions that should be capped and then subtracts the exceptions in the coverage of the emissions trading scheme. The exceptions gained by lobbying.

The Ministry for the Environment started with a gross emissions quantity of 354 million tonnes (mt) over 5 years (or 70.8 mt p.a.). They then subtract 194 mt for agriculture (outside the ETS, 39 mt p.a.), then 43 mt for free industrial allocation (8.6 mt p.a.) and then 27 mt for 'stockpile reduction (5.4 mt p.a.)'. By 'stockpile' they mean the 138 million units in private hands. And that they would like the 138 million units to reduce by less than 1% in 5 years.

The remaining number, 90 mt over 5 years becomes the indicative budget for the new auctions. It is therefore the amount to be auctioned.

The emissions budget under a plain ordinary vanilla cap'n'trade scheme should have been determined by addition. Add up the verified historic greenhouse gases from the inventory and the only subtraction should be the reduction amount to go from historic actual emission to enforceable limit or cap

Five - free industrial allocation of units included non-emitters.

Significant quantitles of emissions units were gifted to non-emitters as compensation or as a cost-reducing measure. The sectors are pre-1990 forest owners, the fishing boat owners and hothouse/glasshouse horticulture exporters. These allocations just lead to more stray units being supplied to the market for emitters to obtain for their increasing emissions. And more units in the private holdings of 138 million unit 'bank'.

Six - just run up an overdraft of emissions units with 'banking and borrowing'

Thanks to the Zero Carbon bill, the legislation provides for 'banking and borrowing' under Section 5ZF. This gives the Minister for Climate Change the power to fail to meet an emissions budget and to make up the difference with 'borrowing' the shortfall from the next emissions budget period. Again that is contrary to the idea of a "cap".

In spite of Minister for Climate Change James Shaw's claim of including a "cap", and in spite of the inclusion of "auctions" and "emissions budgets", the emissions trading scheme is still awash with surplus units. That's the opposite of scarcity of units implied by the word "cap". The emissions trading scheme remains a mix of creative carbon accounting and 'future-eating': emissions growth today and emissions reductions in the future (or maybe not all).