
In this post I revisit and update the analysis of the free emissions units received by New Zealand Steel Limited under the 'Industrial Allocation' rules of the New Zealand Emissions Trading Scheme.
Every year since the New Zealand Emissions Trading Scheme (or "ETS") began, New Zealand Steel Limited has received more emissions units under the Industrial Allocation rules then it has had to surrender to the Government for it's emissions.
New Zealand Steel Limited is therefore always a net seller of emissions units (if it chooses to sell).
New Zealand Steel Limited also alway has an annual surplus of emissions units. This surplus may accumulate if New Zealand Steel Limited chooses to hold.
Should the emissions trading scheme result in New Zealand Steel Limited accumulating a stockpile of emissions units?
In a sensibly designed emissions trading scheme, shouldn't the 'flow' of emissions units be from the emitter, New Zealand Steel, to the Government?
Here is a graph of the greenhouse gas emissions of the New Zealand steel sector from the Greenhouse Gas Inventory. The emissions do not vary much over time. I assume that is because production in the Glenbrook steel smelter is also consistent from year to year.

I know these emissions are from the New Zealand Steel Limited's steel smelting plant in Glenbrook as I looked up New Zealand Steel's actual calendar year 2020 emissions in the EPA report "ETS Participant Emissions" October 2021. New Zealand Steel's reported emissions are (steel 54,431 + stationary energy 762,038 + coal purchase 736,875 equals) 1,553,344 tonnes.
I have marked that data point with a purple circle. The 2020 GHG Inventory steel emissions are 1,578,554; the green circle. The purple and green data points overlap on the graph. So I think it's reasonable to use the GHG Inventory steel industry emissions as an estimate of New Zealand Steel's actual emissions from 1990 to 2020.
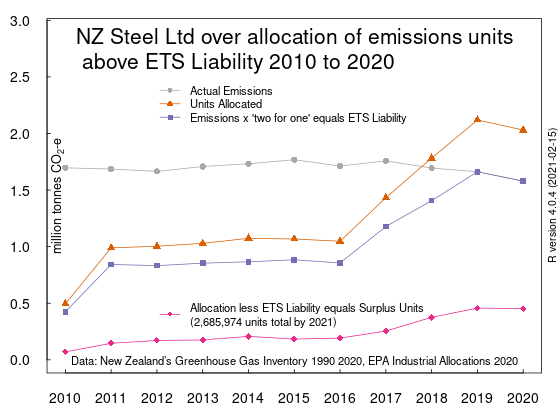
Here is the same graph but with the industrial allocation of free emissions units added.

The free emissions units don't seem to relate logically to the steel emissions. The free units seem to be roughly half of the emissions until 2016 then the free units increase anually until they are greater than the emissions in years 2018 2019 and 2020. What's going on?
There is another variable to take into account. In 2009 Minister for Climate Change Issues Nick Smith introduced the '1 for 2' surrender obligation which halved the unit surrender liability of emitters. It was part of the 'transitional measures' which were to end after 2012 (to coincide with the end of the Kyoto Protocol commitment). Here is a screen capture of a summary of Smith's amendment of the emissions trading scheme.

In 2012, the then Minister Tim Groser indefinitely extended the "one for two" deal where non-forestry participants in the ETS had to surrender one eligible unit for every two tonnes of emissions.
After a 2016 review, this discount was phased out from 2017. See this screen capture from the EPA's website.

The phase out; 2017; 1 unit for each 1.5 whole tonnes of emissions, 2018; - 1 unit for each 1.2 whole tonnes of emissions. And finally in 2019; the ETS gets to 1 unit for each 1 whole tonne of emissions.
So I need to factor in the discount to estimate the actual liability to surrender units under the Emissions Trading Scheme. That is steel emissions multiplied by a discount factor (0.25 units for a tonne of emissions in 2010 as the ETS applied for half of 2010, 0.5 for 2011 to 2016, 0.67 for 2017, 0.83 for 2018, 1 unit per tonne for 2019 and 2020). I have added the ETS liability in blue lines and square points

Well what do you know? The annual allocation of free emissions units always exceeds the ETS liability to surrender units. New Zealand Steel Limited has never had to surrender any emission units under the ETS. New Zealand Steel Limited is always a net seller of emissions units.
The rationalisation for the annual surplus of units over ETS liability is that New Zealand Steel Limited's 'Allocation Factor' for steel smelting includes an 'Electricity Allocation Factor'. This factor includes the costs associated with the NZ ETS that are expected to flow to eligible firms through electricity prices. So the industrial allocation of units exceeds direct steel smelting emissions. Therefore the carbon price that New Zealand Steel is exposed under the ETS is through the costs of it's electricity supply contracts.
I think that this electricity ETS pass-through cost is an imaginary artefact. It can only be detected by 'modelling'; that is to say fiddling numbers on a spreadsheet. It is confused with coal fired generation setting the marginal cost of electricity in the wholesale market. I think it is implausible that a high-volume contract for electricity supply negotiated by a large corporate such as New Zealand Steel with market power includes any carbon price pass-through cost.
The next graph shows the annual excess or surplus of allocated emission units over the estimated number of emissions units actually surrendered back to the Government.
Back in 2016, I asked why does the Emissions Trading Register show that New Zealand Steel Limited owned over 1 million emission reduction units (internationally sourced, bargain priced and probably fraudulent 'hot air' units) at the end of 2013 and 2014, given it never needed to buy emissions units to meet it's ETS obligations?

The answer is that New Zealand Steel intentionally made windfall arbitrage profits. I argued they would have surrendered the much cheaper "hot air" emission reduction units to the Government for its steel emissions in 2013 and 2014 and stockpiled the more valuable (and permanent in duration) NZUs (New Zealand Units).
Lets add the emission reduction units to our chart as teal green points (and lines) in 2013, 2014 and 2015.

The point being that these units just add to the growing 'stockpile' of units owned by New Zealand Steel. In this next chart I have added the growing stockpile as the red line, resized the Y axis and I have 'grayed out' the annual emissions, the allocations, the ETS surrender liability and the annual surplus of units.
The two biggest annual increases in the stockpile are 2013 and 2014 when New Zealand Steel bought the cheap ERUs and stockpiled the allocated NZUs.

If New Zealand Steel surrendered the cheaper ERUs for it's ETS liabilities and kept all surplus NZU emission units, they would own 4.7 million units at the end of 2020. For their 2022 stock of units that is an under estimate as New Zealand Steel has been allocated more units in May 2021 and in May 2022. The 4.7 million units will have a current market value of $364 million based on a carbon price of $76.90
So my final question is: How can accumulating a holding of emission units worth $364 million possibly be a sensible outcome from a policy intended to incentivise the reduction of greenhouse gas emissions? Instead, the emitter ends up with a financial asset making considerable capital gains and unrealised capital gains income. The effect of the emissions trading scheme is extra annual income to New Zealand Steel - instead of a cost/carbon price. How is this possibly compatible with a net zero in 2050 policy?
No comments:
Post a Comment